
Compare Tembo Global with Similar Stocks
Stock DNA
Miscellaneous
INR 1,048 Cr (Micro Cap)
11.00
23
0.18%
0.52
20.19%
2.32
Total Returns (Price + Dividend) 
Latest dividend: 1 per share ex-dividend date: Jan-16-2026
Risk Adjusted Returns v/s
Returns Beta

News
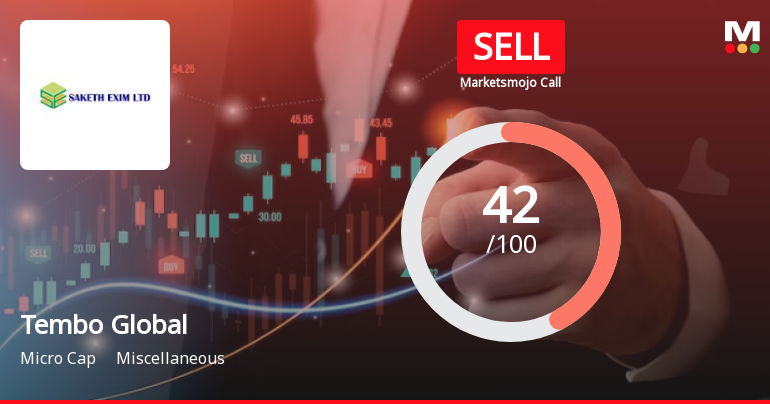
Tembo Global Industries Ltd is Rated Sell
Tembo Global Industries Ltd is rated Sell by MarketsMOJO, with this rating last updated on 01 June 2026. However, the analysis and financial metrics discussed here reflect the stock’s current position as of 07 July 2026, providing investors with the most up-to-date view of the company’s fundamentals, returns, and technical outlook.
Read full news article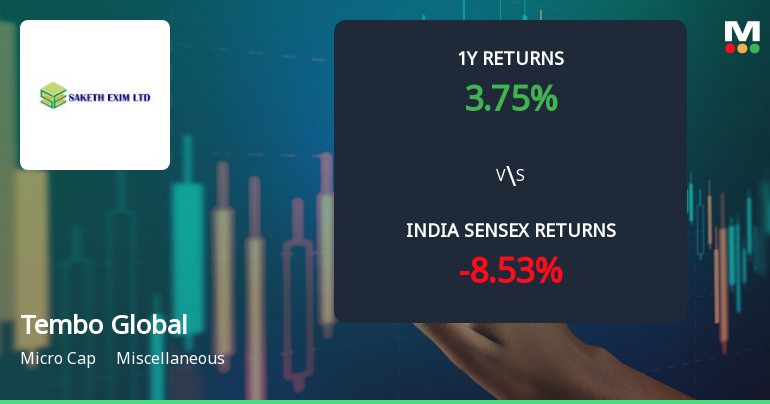
Tembo Global Industries Ltd Sees Mixed Technical Signals Amid Mild Momentum Shift
Tembo Global Industries Ltd has experienced a notable shift in its technical parameters, reflecting a complex interplay of bullish and bearish signals. Despite a 3.38% gain on the day, the stock’s overall momentum and technical indicators suggest a cautious outlook, with a downgrade in its Mojo Grade from Hold to Sell as of 1 June 2026.
Read full news article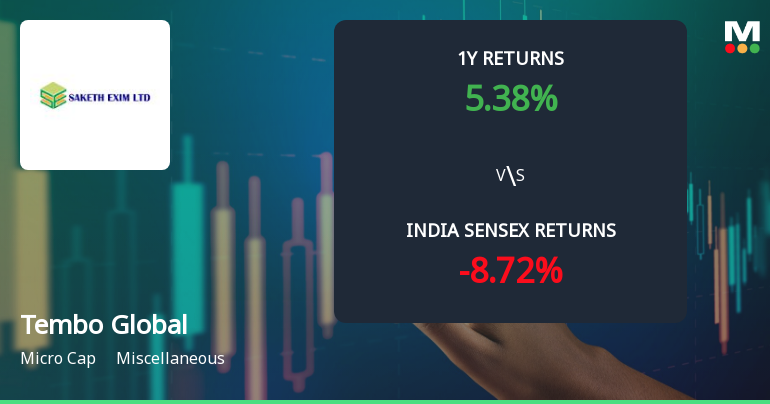
Tembo Global Industries Ltd Faces Bearish Momentum Amid Technical Downgrade
Tembo Global Industries Ltd, a micro-cap player in the miscellaneous sector, has experienced a notable shift in its technical momentum, prompting a downgrade in its MarketsMOJO grade from Hold to Sell as of 1 June 2026. The stock’s recent price action and technical indicators signal a bearish trend, raising concerns for investors amid a challenging market backdrop.
Read full news article Announcements
Saketh Exim Limited - Outcome of Board Meeting
09-Dec-2019 | Source : NSESaketh Exim Limitedf equity investment in right issue in wholly owned subsidiary company SAKETH SEVEN STAR INDUSTRIES PRIVATE LIMITED of Rs.9000000/- (900000 shares at Rs 10/- each).
Saketh Exim Limited - Updates
18-Nov-2019 | Source : NSESaketh Exim Limited has informed the Exchange regarding 'NEWS PAPER ADVERTISEMENT COPY FOR UN AUDITED RESULT HALF YEAR ENDED OF 30,SEPTEMBER ,2019'.
Saketh Exim Limited - Outcome of Board Meeting
14-Nov-2019 | Source : NSESaketh Exim Limited has informed the Exchange regarding Board meeting held on November 13, 2019.
Corporate Actions

No Upcoming Board Meetings

Tembo Global Industries Ltd has declared 10% dividend, ex-date: 16 Jan 26

No Splits history available

Tembo Global Industries Ltd has announced 1:1 bonus issue, ex-date: 03 Mar 21

Tembo Global Industries Ltd has announced 25:9 rights issue, ex-date: 08 Aug 22
Quality key factors
Valuation key factors
Technicals key factors
 Technical Indicator Scale: Bearish, Mildly Bearish, Sideways, Mildly Bullish, Bullish Turned
 Shareholding Snapshot : Jun 2026
Shareholding Compare (%holding)
Non Institution
33.6644
Held by 0 Schemes
Held by 16 FIIs (8.53%)
Fatema Shabbir Kachwala (15.9%)
Murtuza Z Mandsaurwalla (3.49%)
40.42%
Quarterly Results Snapshot (Consolidated) - Mar'26 - QoQ

QoQ Growth in quarter ended Mar 2026 is 38.00% vs 2.16% in Dec 2025

QoQ Growth in quarter ended Mar 2026 is 6.28% vs 26.10% in Dec 2025
Half Yearly Results Snapshot (Consolidated) - Sep'25
Growth in half year ended Sep 2025 is 68.87% vs 49.84% in Sep 2024
Growth in half year ended Sep 2025 is 95.50% vs 181.69% in Sep 2024
Nine Monthly Results Snapshot (Consolidated) - Dec'25
YoY Growth in nine months ended Dec 2025 is 61.81% vs 48.17% in Dec 2024
YoY Growth in nine months ended Dec 2025 is 77.42% vs 214.37% in Dec 2024
Annual Results Snapshot (Consolidated) - Mar'26
YoY Growth in year ended Mar 2026 is 46.68% vs 69.49% in Mar 2025
YoY Growth in year ended Mar 2026 is 79.18% vs 258.69% in Mar 2025
About Tembo Global Industries Ltd

Company Coordinates


