
Compare The Bombay Burma with Similar Stocks
Dashboard
Poor long term growth as Net Sales has grown by an annual rate of 7.84% and Operating profit at 7.04% over the last 5 years
Flat results in Mar 26
With ROE of 16.5, it has a Very Expensive valuation with a 1.5 Price to Book Value
Despite the size of the company, domestic mutual funds hold only 1.92% of the company
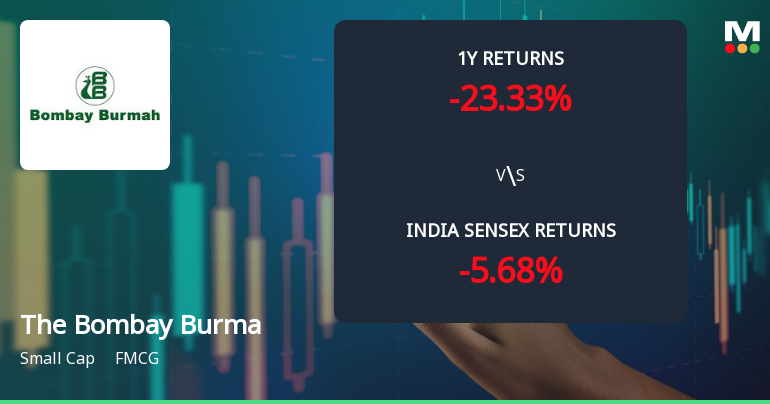
Below par performance in long term as well as near term
Total Returns (Price + Dividend) 
Latest dividend: 16.933221099887767 per share ex-dividend date: Feb-20-2026
Risk Adjusted Returns v/s
Returns Beta

News
The Bombay Burmah Trading Corporation Ltd: Technical Momentum Shifts Amid Mixed Market Signals
The Bombay Burmah Trading Corporation Ltd has experienced a notable shift in its technical momentum, moving from a bearish to a mildly bearish trend. Despite a 2.59% gain on the day, the stock’s technical indicators present a complex picture, with mixed signals from MACD, RSI, moving averages, and other momentum oscillators. This article analyses these technical parameters in detail, placing the stock’s recent performance in the context of its broader market and sector trends.
Read full news article
The Bombay Burmah Trading Corporation Ltd is Rated Sell
The Bombay Burmah Trading Corporation Ltd is rated Sell by MarketsMOJO, with this rating last updated on 29 December 2025. However, the analysis and financial metrics discussed here reflect the company’s current position as of 27 July 2026, providing investors with an up-to-date perspective on the stock’s fundamentals, valuation, financial trend, and technical outlook.
Read full news article
The Bombay Burmah Trading Corporation Ltd is Rated Sell
The Bombay Burmah Trading Corporation Ltd is rated 'Sell' by MarketsMOJO, with this rating last updated on 29 December 2025. However, the analysis and financial metrics discussed here reflect the stock's current position as of 16 July 2026, providing investors with an up-to-date view of the company’s fundamentals, valuation, financial trends, and technical outlook.
Read full news article Announcements
Disclosure Under Regulation 30 Of SEBI (Listing Obligations And Disclosure Requirements) Regulations 2015
21-Jul-2026 | Source : BSEPlease find enclosed disclosure under Regulation 30 of SEBI (Listing Obligations and Disclosure Requirements) Regulations 2015.
Announcement under Regulation 30 (LODR)-Newspaper Publication
18-Jul-2026 | Source : BSEPlease find enclosed Newspaper Advertisment of the Notice of 161st Annual General Meeting and E-Voting Information
Reg. 34 (1) Annual Report.
17-Jul-2026 | Source : BSEAs per Regulation 34(1) of SEBI(LODR) Regulations 2015 please find attached herewith the Annual Report of the Corporation for the financial year ended 31st March 2026
Corporate Actions

No Upcoming Board Meetings

The Bombay Burmah Trading Corporation Ltd has declared 850% dividend, ex-date: 20 Feb 26

The Bombay Burmah Trading Corporation Ltd has announced 2:10 stock split, ex-date: 08 Nov 12

No Bonus history available

No Rights history available
Quality key factors
Valuation key factors
Technicals key factors
 Technical Indicator Scale: Bearish, Mildly Bearish, Sideways, Mildly Bullish, Bullish Turned
 Shareholding Snapshot : Jun 2026
Shareholding Compare (%holding)
Promoters
None
Held by 17 Schemes (0.5%)
Held by 163 FIIs (9.46%)
Nowrosjee Wadia & Sons Limited (41.95%)
Acacia Institutional Partners, Lp (1.5%)
12.03%
Quarterly Results Snapshot (Consolidated) - Mar'26 - QoQ

QoQ Growth in quarter ended Mar 2026 is -4.89% vs 2.49% in Dec 2025

QoQ Growth in quarter ended Mar 2026 is 40.35% vs 30.89% in Dec 2025
Half Yearly Results Snapshot (Consolidated) - Sep'25
Growth in half year ended Sep 2025 is 6.16% vs 5.62% in Sep 2024
Growth in half year ended Sep 2025 is 1.55% vs 1,491.74% in Sep 2024
Nine Monthly Results Snapshot (Consolidated) - Dec'25
YoY Growth in nine months ended Dec 2025 is 6.83% vs 6.43% in Dec 2024
YoY Growth in nine months ended Dec 2025 is -1.88% vs 92.63% in Dec 2024
Annual Results Snapshot (Consolidated) - Mar'26
YoY Growth in year ended Mar 2026 is 6.78% vs 6.95% in Mar 2025
YoY Growth in year ended Mar 2026 is 10.69% vs 76.35% in Mar 2025
About The Bombay Burmah Trading Corporation Ltd

Company Coordinates


