
Compare United Credit with Similar Stocks
Stock DNA
Non Banking Financial Company (NBFC)
INR 15 Cr (Micro Cap)
17.00
21
0.00%
0.01
2.82%
0.49
Total Returns (Price + Dividend) 
Latest dividend: 0.7 per share ex-dividend date: Sep-19-2019
Risk Adjusted Returns v/s
Returns Beta

News
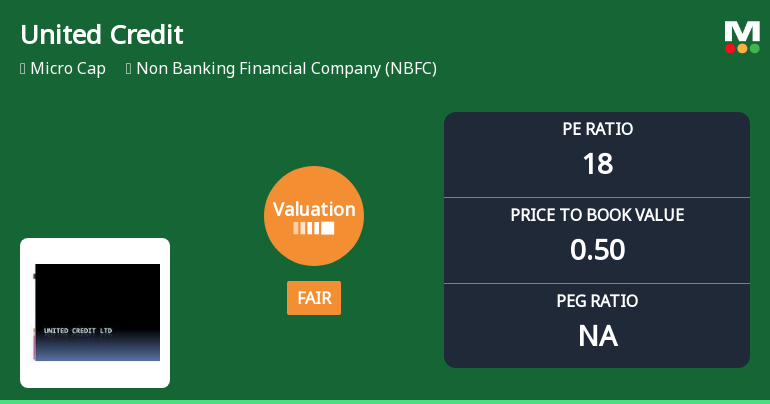
United Credit Ltd Valuation Shifts to Fair Amid Mixed Market Performance
United Credit Ltd, a micro-cap player in the Non Banking Financial Company (NBFC) sector, has seen its valuation grade shift from attractive to fair, reflecting a nuanced change in investor sentiment despite recent price gains. The company’s price-to-earnings (P/E) ratio now stands at 17.59, signalling a more balanced valuation compared to its historical lows and peer group extremes.
Read full news article
United Credit Ltd Valuation Shifts: From Attractive to Fair Amid Mixed Market Signals
United Credit Ltd, a micro-cap player in the Non Banking Financial Company (NBFC) sector, has experienced a notable shift in its valuation parameters, moving from an attractive to a fair rating. Despite a robust 9.05% gain in a single trading session, the company’s fundamental metrics and relative valuation compared to peers reveal a complex picture for investors navigating this micro-cap stock.
Read full news article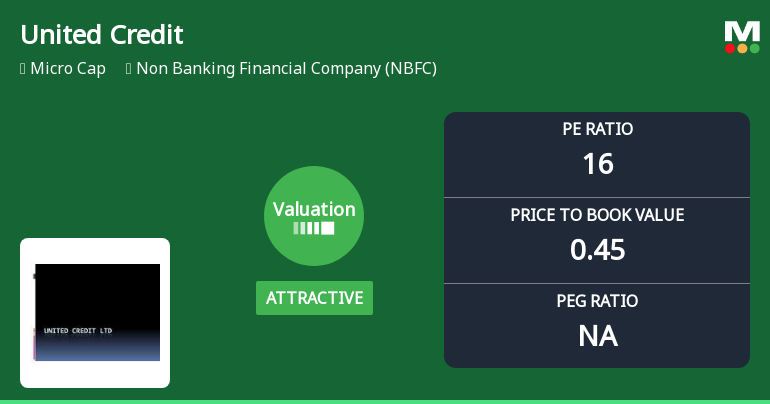
United Credit Ltd Valuation Shifts Signal Renewed Price Attractiveness Amid Market Pressure
United Credit Ltd, a micro-cap player in the Non Banking Financial Company (NBFC) sector, has seen a notable shift in its valuation parameters, moving from fair to attractive territory despite recent share price declines. This change comes amid a challenging market environment where the stock has underperformed key benchmarks, prompting a reassessment of its price-to-earnings and price-to-book value metrics relative to peers and historical averages.
Read full news article Announcements
Compliances-Certificate under Reg. 74 (5) of SEBI (DP) Regulations 2018
07-Jul-2026 | Source : BSEWe confirm that our Registrars MUFG Intime India Private Limited C-101 Embassy 247 L.B.S. Marg Vikhroli (West) Mumbai - 400083 comply with the Regulation 74(5) of SEBI (DP) Regulations 2018 and inform the Stock Exchange was the shares of the Company are listed National Securities Depository Limited and Central Depository Services (India) Limited whenever they receive any certificate of security from the participant. A copy of MUFG Intime India Private Limiteds letter dated 1st July 2026 addressed to the Company to this effect is enclosed
Closure of Trading Window
25-Jun-2026 | Source : BSEPursuant to the SEBI (Prohibition of Insider Trading) Regulations 2015 United Credit Limited has informed about Closure of Trading Window
Compliances-Reg.24(A)-Annual Secretarial Compliance
29-May-2026 | Source : BSEPlease find enclosed herewith Annual Secretarial Compliance Report for the year ended March 31 2026
Corporate Actions

No Upcoming Board Meetings

United Credit Ltd has declared 7% dividend, ex-date: 19 Sep 19

No Splits history available

No Bonus history available

No Rights history available
Quality key factors
Valuation key factors
Technicals key factors
 Technical Indicator Scale: Bearish, Mildly Bearish, Sideways, Mildly Bullish, Bullish Turned
 Shareholding Snapshot : Jun 2026
Shareholding Compare (%holding)
Promoters
None
Held by 0 Schemes
Held by 0 FIIs
Dabriwala Banijya Udyog Limited (43.16%)
United Nanotech Products Limited (13.93%)
23.0%
Quarterly Results Snapshot (Standalone) - Mar'26 - QoQ

QoQ Growth in quarter ended Mar 2026 is 7.79% vs 1.32% in Dec 2025
QoQ Growth in quarter ended Mar 2026 is 37.50% vs -30.43% in Dec 2025
Half Yearly Results Snapshot (Standalone) - Sep'25

Growth in half year ended Sep 2025 is -13.22% vs 8.75% in Sep 2024
Growth in half year ended Sep 2025 is -30.43% vs 35.29% in Sep 2024
Nine Monthly Results Snapshot (Standalone) - Dec'25
YoY Growth in nine months ended Dec 2025 is -13.31% vs 7.79% in Dec 2024
YoY Growth in nine months ended Dec 2025 is -33.33% vs -20.66% in Dec 2024
Annual Results Snapshot (Standalone) - Mar'26
YoY Growth in year ended Mar 2026 is -9.59% vs 1.18% in Mar 2025
YoY Growth in year ended Mar 2026 is -14.85% vs -38.41% in Mar 2025
About United Credit Ltd

Company Coordinates


