
Compare NDR INVIT Trust with Similar Stocks
Dashboard
Strong Long Term Fundamental Strength with a 227.67% CAGR growth in Operating Profits
Healthy long term growth as Net Sales has grown by an annual rate of 213.60% and Operating profit at 227.67%
Flat results in Mar 26
With ROE of 3, it has a Very Expensive valuation with a 1.7 Price to Book Value
Rising Promoter Confidence
Total Returns (Price + Dividend) 
Latest dividend: 1.358 per share ex-dividend date: Jun-02-2026
Risk Adjusted Returns v/s
Returns Beta

News
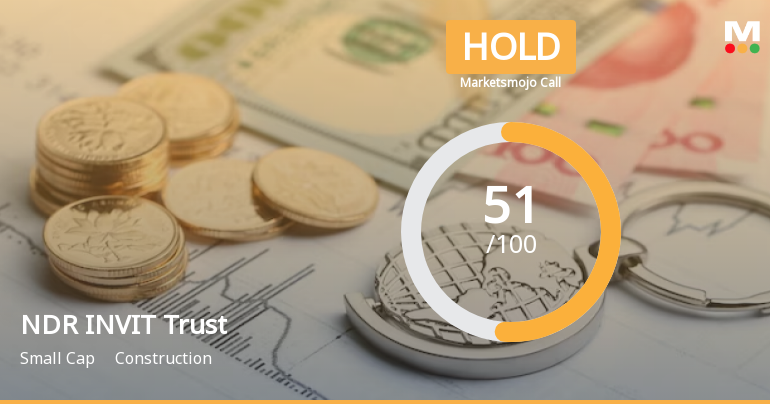
NDR INVIT Trust is Rated Hold by MarketsMOJO
NDR INVIT Trust is rated 'Hold' by MarketsMOJO, with this rating last updated on 20 July 2026. While the rating change occurred on that date, the analysis and financial metrics discussed here reflect the stock's current position as of 28 July 2026, providing investors with the latest insights into its performance and outlook.
Read full news article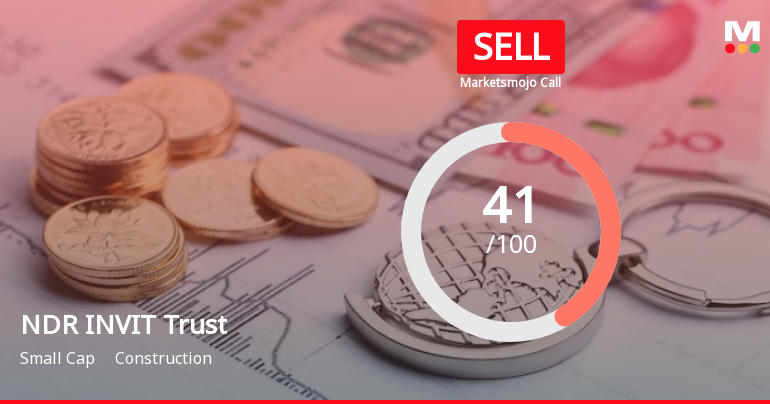
NDR INVIT Trust is Rated Sell by MarketsMOJO
NDR INVIT Trust is rated Sell by MarketsMOJO, with this rating last updated on 15 Jul 2026. However, the analysis and financial metrics discussed here reflect the stock’s current position as of 17 July 2026, providing investors with the most up-to-date insight into the company’s performance and outlook.
Read full news article
NDR INVIT Trust is Rated Hold by MarketsMOJO
NDR INVIT Trust is rated 'Hold' by MarketsMOJO, a rating that was last updated on 10 April 2026. While this rating change occurred in April, the analysis and financial metrics discussed here reflect the stock’s current position as of 06 July 2026, providing investors with the most up-to-date perspective on the company’s performance and outlook.
Read full news article Announcements
Corporate Actions

No Upcoming Board Meetings

NDR INVIT Trust has declared 1% dividend, ex-date: 02 Jun 26

No Splits history available

No Bonus history available

No Rights history available
Quality key factors
Valuation key factors
Technicals key factors
 Technical Indicator Scale: Bearish, Mildly Bearish, Sideways, Mildly Bullish, Bullish Turned
 Shareholding Snapshot : Jun 2026
Shareholding Compare (%holding)
Non Institution
12.121
Held by 0 Schemes (0.07%)
Held by 0 FIIs (1.36%)
Ndr Warehousing Pvt Ltd (20.03%)
360 One Income Opportunities Fund Series 4 (3.66%)
24.22%
Quarterly Results Snapshot (Standalone) - Mar'26 - QoQ

QoQ Growth in quarter ended Mar 2026 is -14.91% vs 20.87% in Dec 2025
QoQ Growth in quarter ended Mar 2026 is -29.21% vs 37.24% in Dec 2025
Half Yearly Results Snapshot (Consolidated) - Sep'25

Growth in half year ended Sep 2025 is 18.00% vs 15.71% in Mar 2025
Growth in half year ended Sep 2025 is 8.28% vs 5.19% in Mar 2025
Nine Monthly Results Snapshot (Standalone) - Dec'25
Not Applicable: The company has declared_date for only one period
Not Applicable: The company has declared_date for only one period
Annual Results Snapshot (Consolidated) - Mar'26
YoY Growth in year ended Mar 2026 is 29.66% vs 658.68% in Mar 2025
YoY Growth in year ended Mar 2026 is -15.24% vs 631.16% in Mar 2025
About NDR INVIT Trust

Company Coordinates


