To make investing decisions, many a times we want to compare the business models of companies in one sector to understand if we can explain the differences in valuation and also which company has better financial metrics.
Let me take an example,
Dabur India and Godrej Consumer have been two big “Made in India” success stories in the FMCG sector, a sector which has been dominated by global giants such as Unilever and P&G. It would be interesting to compare these two amazing companies.
The Market Cap of the two companies are very similar
As the table below shows, the stock market has been recognizing the potential of these companies and the 10 year price returns of these two companies are far higher than that of Hindustan Unilever and the overall market.
| Company | Market Cap | 10 Year Return |
| Godrej Consumer | Rs. 797 bn | 1958% |
| Dabur India | Rs. 769 bn | 854% |
| Hindustan Unilever | Rs. 3449 bn | 539% |
| BSE Sensex | – | 190% |
After this phenomenal performance over the past few years, Interestingly the Current Market Cap of these two companies is very similar.
Two companies, two different approaches
These two companies with long legacies of more than 120+ years each have taken different paths to achieve success. Dabur describes itself as “One of the Best Ayurvedic Companies in India” whereas Godrej calls itself the “Largest home-grown home and personal care company in India.”
But, Both have global ambitions
Dabur’s products are today available in over 120 countries across the globe. Dabur’s overseas revenue today accounts for over 30% of the total turnover. While Godrej is largest household insecticide and hair care players in emerging markets. In household insecticides, they are the leader in India, the second largest player in Indonesia and are now expanding our footprint in Africa. They are the leader in hair extensions in Africa, the number one player in hair colour in India and Sub-Saharan Africa and among the leading players in Latin America. They are the number one player in air fresheners and wet tissues in Indonesia.
Both Have a Large and Diverse Portfolio
Dabur today operates in key consumer product categories like Hair Care, Oral Care, Health Care, Skin Care, Home Care and Foods.
Dabur India has portfolio of over 250 Herbal/Ayurvedic products. Dabur’s FMCG portfolio today includes five flagship brands with distinct brand identities — Dabur as the master brand for natural healthcare products, Vatika for premium personal care, Hajmola for digestives, Réal for fruit juices and beverages and Fem for fairness bleaches and skin care products.
Godrej Consumer’s products include soap, hair colourants, toiletries and liquid detergents. Its brands include ‘Cinthol’, ‘Godrej Fair Glow’, ‘Godrej No.1’ and ‘Godrej Shikakai’ in soaps, ‘Godrej Powder Hair Dye’, ‘Renew’, ‘ColourSoft’ in hair colourants and ‘Ezee’ liquid detergent.
How do the Financials of these two companies stack up?
A very interesting tool to compare the business model of two companies in similar businesses is the DuPont Analysis.
What is DuPont Analysis?
The genesis of the analysis was a framework developed by the DuPont Corporation of the USA. DuPont analysis is great measure of fundamental performance of a company. This analysis decomposes the key drivers of Return on Equity (ROE). ROE is one of the most important measure of a company’s profitability.
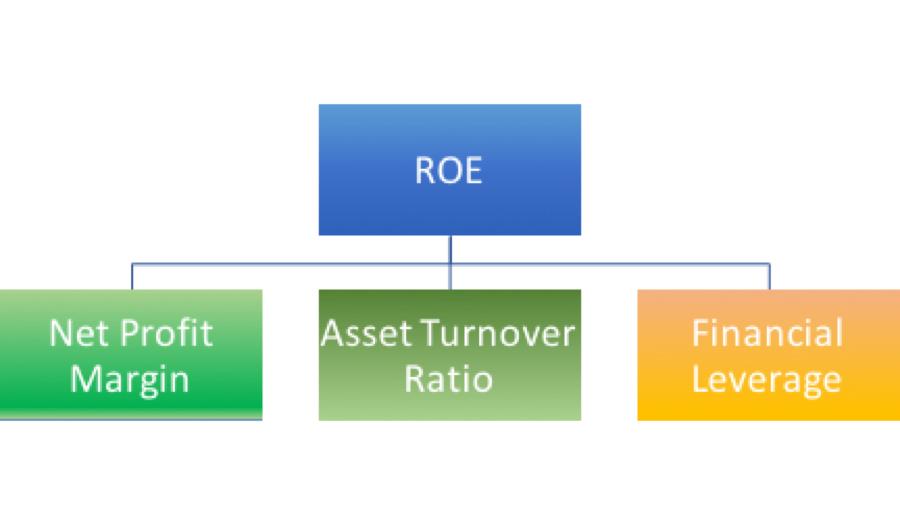
Return on Equity =
Net Profit Margin x Asset Turnover Ratio x Financial Leverage
Where,
- Net Profit Margin = (Net Income / Sales)
The Net Profit Margin signifies the Profit that is extracted per rupee of Sales. Everything else remaining same, a company which has a higher Net Profit Margin has a higher ROE.
- Asset Turnover Ratio = (Sales / Total Assets)
This ratio is an efficiency measurement used to determine how effectively a company uses its assets to generate revenue. Higher the Asset Turnover Ratio, higher the ROE, everything else remaining the same.
- Financial Leverage = (Total Assets / Total Equity)
Financial Leverage measure whether a company finances the purchase of assets primarily through debt or equity. The higher the Financial Leverage the higher the ROE. Financial Leverage when it becomes excessive can increase the risk of bankruptcy.
So, what does the Dupont Analysis tells us for Dabur and Godrej?
Here are the numbers:
| Consolidated (Rs. Cr) | Dabur
FY 2018 |
Godrej Consumer
FY2018 |
| Total Sales | 8054 | 10045 |
| Net Profits | 5733 | 6258 |
| Net Assets | 6424 | 9852 |
| Total Equity | 1358 | 1671 |
| Dabur
FY 2018 |
Godrej Consumer
FY2018 |
|
| Net Profit Margin | 16.9% | 16.6% |
| Asset Turnover Ratio | 1.25 | 1.02 |
| Financial Leverage | 1.12 | 1.57 |
| Return on Equity | 23.6% | 26.6% |
The ROEs of Godrej is 300 bps higher than Dabur’s. So one would think that Godrej has better Financial metrics.
However, a Deeper look at the Dupont Analysis reveals a different story.
While the Net Profit Margins for the two companies are similar, Dabur utilises its assets better than Godrej Consumer as can be seen in the Asset Turnover Ratio of Dabur at 1.25 vs Godrej at 1.02
Also, Godrej’s ROE is enhanced by taking a higher Financial Leverage.
So in effect, Dabur has better financial metrics than Godrej.
In general, the Stock Market gives a higher Valuation to a company which has better Financial Metrics.
Thus, it should not come as a surprise that the Valuation of Dabur with a P/E of 54.2 x is higher than that of Godrej who has a P/E of 49x!
This analysis was just to highlight the simplicity of Dupont Analysis and its power. For a more meaningful research one needs to do a longer-term analysis. One year is not enough.
Would love to hear your thoughts and any additional analysis that you may have done.

Sanjeev Mohta
Market Expert
Sanjeev Mohta is the Market Expert at Marketsmojo. He has over 27 years’ experience in Investment Research and Fund management across Asian Markets and Asset classes. He has worked in various organisations in Singapore and India like Alchemy, QVT, Jefferies, ABN Amro and HSBC Securities. He Has a PhD in Economics from Tulane University, USA.