“BSNL, Air India, MTNL worst performing PSUs in FY17” screamed a headline in Economic Times a couple of weeks ago.
“Bandhan Bank Is India’s Eighth Largest Lender By Market Value” claimed a Bloomberg Quint headline on March 28. Bandhan Bank, which started as a microfinance company and received a Banking license only 4 years ago, listed with a market cap which was Rs 18000 crore more than the market cap of Bank of Baroda. Bank of Baroda is more than 100-years old with Assets which are almost 23 times that of Bandhan Bank!
These may sound like two random stories, but I believe these two stories are related.
They have a common thread and it all started in the 1990s.
Let us put this in perspective
First, the numbers behind the Economic Times report; The Department of Public Enterprises have been publishing an Annual Survey since 1960-61 where it gives a detailed analysis of the performance of various Public Sector companies. Recently it published its 57thedition for year 2016-17.
Based on the data provided I have compiled the following table. The table shows the 5 non-banking companies with the highest loss for the Cumulative 3-year period between FY 2014 and FY 2017.
|
Cumulative Losses FY 2014-FY 2017 (Rs Cr) |
|
| BSNL | (17,886) |
| Air India | (13,648) |
| MTNL | (7,782) |
| Hindustan Photo Fims | (7,609) |
| SAIL | (4,762) |
I will focus on the top three in this list for this story.
Let me start with the story of BSNL and MTNL
In 1994 Telecom Services was opened by the government to private sector.
Although BSNL was formed later in the year 2000, its history is linked with the beginning of telecommunication in India. The foundation of telecom network in India was laid by British sometime in 19th century and the telecom service was run by the Post and Telegraph department. Department of Telecom (DoT) was founded in 1985 as a separate department so as to bring out the focus on Telecom. In 1986 its crown jewels were further carved out from DoT. Mahanagar Telephone Nigam Limited (MTNL) was created to run the telecom services of Delhi and Mumbai and Videsh Sanchar Nigam Limited (VSNL) was created to run the international long-distance operations. These two companies even went public.
To create a more level playing field to fight the private sector competition, the government corporatized the operations part of DoT and on October 01, 2000 Bharat Sanchar Nigam Limited (BSNL) was born. It was one of the largest Telecom company in the world at that point.
After twenty four years of liberalization, where are we now?
As of 31stJanuary 2018, according to TRAI, India has 1.175 billion telephone subscribers. Out of these 1.151 billion are wireless subscribers. The overall tele-density is at 90.6%. Also, India has 378 mn Broadband subscribers.
In 1994, BSNL and MTNL were monopolies, which means they had 100% market-share between them. Today these two Public Sector companies have a combined market-share of 9.7% in the wireless services and less than 6% in Broadband services. They still have a 68% market-share in the landline services but then landline services account for around 2% of all the telephone services!
And we already know that put together these two companies have lost more than Rs. 25000 crore over the last three years!
Also, the MTNL stock is down around 90% over the last 30 years with a market cap of less than Rs. 1200 crore now.
The Air India Story is similar
In April 1990 the Government under its Open-sky policy allowed air taxi- operators to operate flights from any airport. East-West Airlines was the first Indian private airline to operate in India after 1953.
The difference between Telecom and Airlines is that prior to 1953 Indian Airline industry had many private sector players. The Indian Parliament passed the Air Corporations Act, 1953 to nationalize the Industry.
According to Wikipedia “Two new national airlines were to be formed along the same lines as happened in the United Kingdom with British Overseas Airways Corporation (BOAC) and British European Airways (BEA). Eight pre-Independence domestic airlines, Deccan Airways, Airways India, Bharat Airways, Himalayan Aviation, Kalinga Airlines, Indian National Airways and Air Services of India and the Domestic wing of Air India, were merged to form the new domestic national carrier Indian Airlines Corporation. International operations of Air India Ltd was taken over by the newly formed Air India International.”
Since 1990, while many new players came in and some including East West went out, the Public Sector Airlines were going through their own consolidation. In 1993, Vayudoot, a Government owned regional feeder airline was merged with Indian Airlines. Finally in 2011, Indian Airlines was merged with Air India to form a single entity.
And after 28 years of liberalisation, the fate is similar
According to DGCA, in the year 2017, the number of domestic passengers carried by airlines in India was 117 mn. Air India had a market-share of 13.6%. In the year 2013, the corresponding number was 61.4 mn and Air India had a market-share of 19.4%. In effect while Air India grew 30% over the four years, the private sector players doubled their numbers.
So like BSNL and MTNL the market share loss has been huge and as we already know Air India has suffered a huge loss over the last three years.
Let us now look at the Public Sector (PSU) Banks
The case of PSU Banks is more complicated. After the SBI consolidation there are 22 PSU Banks in India. According to IBEF there are 26 Private Sector Banks and 46 Foreign Banks operating in India as well.
The history of Banking is very rich. According to a report, that I came across, at the time of Independence, there were over 600 commercial banks operating in the country mostly privately owned. The process of Nationalisation started in 1955. Imperial Bank was taken over by the government and renamed as State Bank of India.
In 1969, following the Nationalization Act, 14 largest commercial banks were further nationalized. The public-sector banks share went up from around 30% to around 85%. Six more banks were nationalized in 1980. It raised the public-sector banks’ share of to more than 90%.
Like in Telecom and Airlines with liberalisation in the 1990s, the process started getting reversed. Narasimham committee report in 1991 became the blueprint for the changes that followed. Between 1994-95 many new private sector banks including HDFC Bank and ICICI Bank were formed. In this period, while most of the PSU Banks got themselves listed in the stock market, the majority stake remained with the government.
And after 27 years of liberalisation…
The market share numbers of the PSU Banks are much better than that we have witnessed in the Telecom and Airline sectors.
| Data as of March 2017 | % of Total Advances |
| PSU Banks | 68.5% |
| Private Sector Banks | 27.3% |
| Other Banks | 4.2% |
But the rest of the story is very similar.
The PSU Banks as a group reported a huge loss for the December Quarter.
The biggest problem facing the PSU Banks is that, based on RBI numbers, 12.3% of their Advances are Non-Performing as of March 2017. This number has further increased in the last 12 months.
| Data as of March 2017 | Gross NPA | Net NPA |
| PSU Banks | 12.3% | 6.9% |
| Private Sector Banks | 4.2% | 2.2% |
| Other Banks | 4.1% | 0.7% |
The huge losses and fraud cases are further adding to their woes.
As a result of the asset quality problems, the ability to lend further has decreased substantially for these banks and the market share of Public sector is starting to fall more sharply, Economic Times recently quoted an ICRA report which said:
“The market share of private sector banks in banking sector advances is expected to increase to ~38-40% by FY2020 from 19.9% as on March 31, 2014 and 27.5% as on March 31, 2017 respectively. In fact, the ICRA report is estimating an incremental market share of 80% for private banks during FY2018-FY2020. Private sector banks had an almost 100% share in the incremental bank credit in the last twelve months.
Non-banking finance companies are giving a tough competition to the public sector banks as well “eating up their market share”, according to a report released by the Boston Consulting Group (BCG)
The Public Sector Bank story is fast looking like the Air India and BSNL story.
What is scary is that even based on March 2017 numbers the Net NPA for the PSU Banks is 66% or two thirds of the book value! This compares to 12% of book value in the case of Private Sector banks. The situation has only gotten much worse and it required an announcement of Rs. 2.1 trillion recapitalisation package for these banks by the government in October 2017.
The stock market, despite the recapitalisation, has punished the PSU Banks.
We already talked about the market value of Bandhan Bank earlier, but the market cap of all PSU Banks Put together is now Less than the market Cap of HDFC Bank! To put this in context, the Total Advances of the PSU Banks is 2.5 times more than the Total Advances of all the Private Sector Banks put together.
Even the market cap of Bajaj Finance is much more than the market cap of Bank of Baroda, Punjab National Bank and Canara Bank combined.
So, what does this mean?
The question that the above analysis begs is that: Does government need to own these businesses? Unless a business is a natural monopoly or owner of Strategic resources of national importance what value does government ownership add?
This is especially so if the “sector” itself has been privatized. The government owned companies have been badly hurt by private sector competition. Government would have been better off Privatising their companies along with the sector.
In fact, the more the government delays in getting out, the more destruction of value. The decision to get out of Air India now is like getting into a distress sale.
Possibly the decision not to privatize is more to do with the politics of trying to placate the unions and the employees. But if the companies become distressed do the employees really gain?
The lessons for us as Investors
The following chart shows how badly the PSU Banks have underperformed their Private sector counterparts significantly since 2010
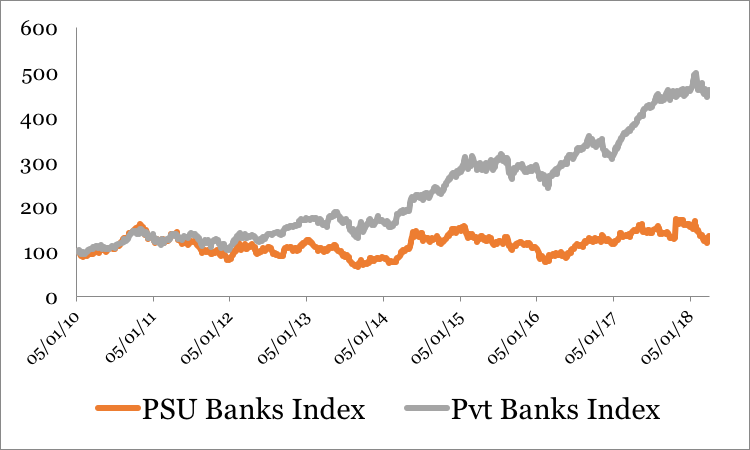
The PSU Index and the PSU Bank Index has also been flat over the last 10 years. The interesting point is to note how closely they move together.
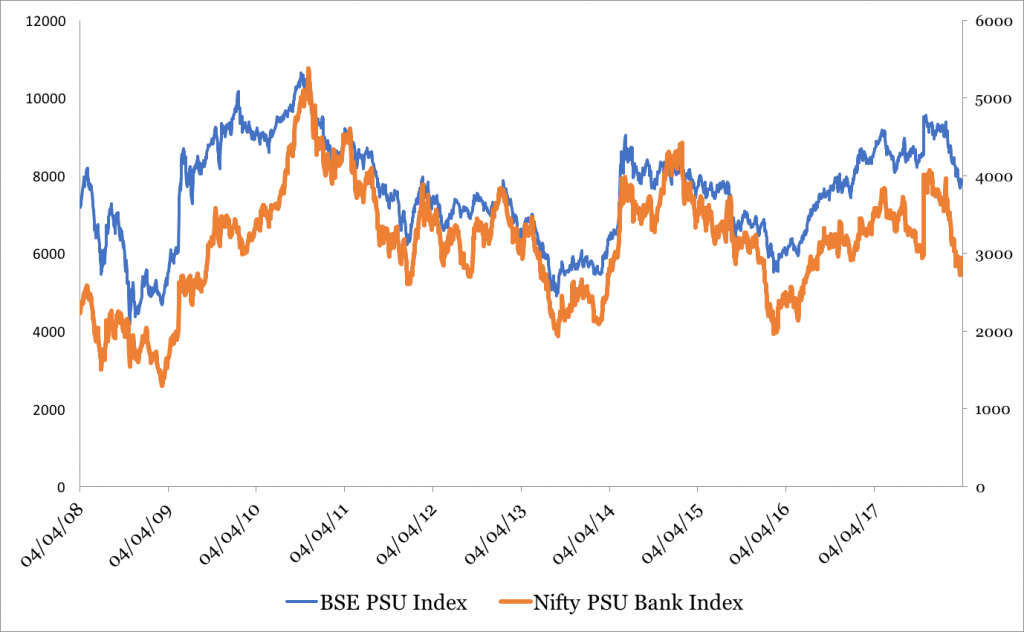
Yes, there have been periods when these PSU companies do very well, especially when a stable government is formed and there is hope that “something positive” will happen, but over the long periods these hopes have been belied and these Indices have moved in a trading range.
Our analysis suggests that buying Public Sector companies in a “privatised” sector is hazardous for long term investing in most cases. They definitely do not qualify as “Buy and Hold” ideas, in general.
This is not to say that there cannot be a short-term spurt. The PSU Banks are trading at 7.5 % of their Advances versus 60% for their Private Sector counterparts. This extreme business based valuation could get a trigger if there is move by the policy makers to solve this problem, but going by the past experience, these at best would be trading opportunities.
Also, in case policy makers do not take a significant step, the long-term story of Market Share shift from PSU Banks to the Private Sector Banks and the Finance companies will stay intact.
Please Note: If Private Sector Banks do well it will get captured in their Financial Trend. Check the Private Sector Banks who have shown 4 Consecutive quarters of Positive Financial Trend on our brand new MojoExpert Screener at https://www.marketsmojo.com/mojo/professional

Sanjeev Mohta
Market Expert
Sanjeev Mohta is the Market Expert at Marketsmojo. He has over 27 years’ experience in Investment Research and Fund management across Asian Markets and Asset classes. He has worked in various organisations in Singapore and India like Alchemy, QVT, Jefferies, ABN Amro and HSBC Securities. He Has a PhD in Economics from Tulane University, USA.