A large number of companies have announced their December Quarter results. Given the negativity surrounding the economy, I thought it will be a good idea to see, as a whole, how corporate India is doing.
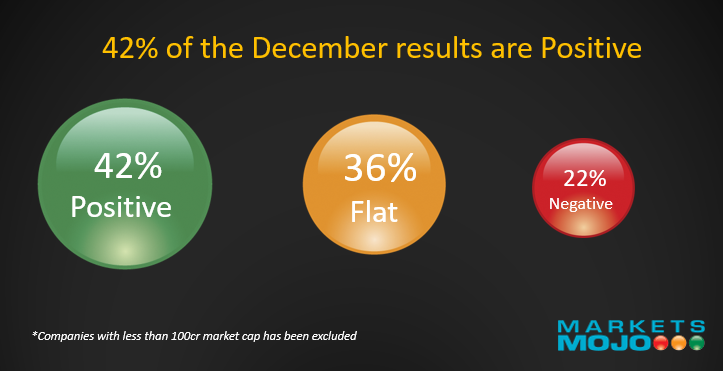
On the face of it based on our Financial Trend Indicator one can see that 42% of the companies have shown positive trend in the December quarter versus 22% which have shown a negative trend. Almost 2: 1 Positive versus Negative.
But let’s look at some more details. Since December 2016 was the Demonetisation Quarter I looked at the results of December 2015 Quarter as well. For this analysis, I have taken companies with Market Cap more than Rs. 100 cr and also only those which have data for available for December 2015 quarter as well. The sample size for this study is around 1000 companies which is large enough.
For better analysis, I have divided the companies into two segments:
- All companies which are not in Banking, Finance & Insurance (ex BFSI)
- Banking, Finance and Insurance companies. I have taken out Public Sector Banks from this analysis.
The two tables below summarize the results showing Year over Year growth.
| Ex BFSI | Dec-17 | Dec-16 | Dec-15 |
| Sales (Rs bn) | 12,977 | 11,337 | 10,562 |
| Sales Growth (YoY) | 14% | 7% | – |
| Operating Profit (Rs bn) | 2,205 | 1,848 | 1,651 |
| OP Growth (YoY) | 19% | 12% | – |
| Operating Margin | 17.0% | 16.3% | 15.6% |
| BFSI (ex Pub Sector Banks) | Dec-17 | Dec-16 | Dec-15 |
| Net Revenue (Rs. bn) | 1,634 | 1,442 | 1,220 |
| Net Revenue Growth (YoY) | 13% | 18% | – |
| Profit Before Tax (Rs. bn) | 350 | 303 | 297 |
| PBT Growth (YoY) | 15% | 2% | – |
| PBT Growth (Non Banking Finance) | 21% | 20% | – |
The key finding from the above:
- The ex-BFSI segment has accelerated its Sales Growth form 7% to 14% and Operating Profit Growth from 12% to 19%. Pat of this could be because December 2016 quarter was impacted by Demonetization.
- The Operating Margins have consistently improved over the last three years from 15.6% to 17%. A 140bps improvement in margin.
- The BFSI data is also good other than the Public-Sector Banks, which cumulatively have shown a Huge Loss due to write off of Non-Performing Assets.
- December 2017 Quarter has seen a growth of 13% in Revenue and 15% in Profit Before Tax.
- If one takes out all the Banks, the PBT growth of the Non Banking Financial sector continues to be a robust 20%+
Overall, these results show that Corporate India is in fine shape. Most of the large sectors are showing positive growth both in Topline and Bottomline and also the profitability is improving. (Telecom is one exception) If the Economy improves, and if GST results in larger companies benefiting these companies will do even better.
The Public Sector Banks continue to be an area of concern. Of course, the government and the RBI realize the problem and we need to see how the Capital Infusion and the cleaning up play out.
Here’s a list of the Top 5 Mega-Cap companies (Market Cap > Rs. 60,000 cr) with the highest Financial Trend Score for the December 2017 quarter.
| Mojo Financial Trend Score | |
| Avenue Supermarts Ltd. | 25 |
| Bajaj Finance Ltd. | 21 |
| Tata Steel Ltd. | 21 |
| JSW Steel Ltd. | 21 |
| Adani Ports and Special Economic Zone Ltd. | 18 |
Note: You can check the results of all your companies on our Results Corner https://www.marketsmojo.com/mojo/resultcorner and also on individual company pages.

Sanjeev Mohta
Market Expert
Sanjeev Mohta is the Market Expert at Marketsmojo. He has over 27 years’ experience in Investment Research and Fund management across Asian Markets and Asset classes. He has worked in various organisations in Singapore and India like Alchemy, QVT, Jefferies, ABN Amro and HSBC Securities. He Has a PhD in Economics from Tulane University, USA.