Like in most sports, when we Invest in any market, it is always important to survey the “playing field”. It helps to find who the other “players” are and what their behaviour is. The reason is simple. We do not invest in isolation and how the markets behave depends on the collective behaviour of each player.
In an endeavor to get a better understanding of the playing field called “Indian stock market”, I have aggregated data from all the listed companies and looked deeper at the ownership pattern. This gives some clue as to who the key players are.
With more than 4500 listed companies, India’s Market Cap, as of May 15, 2018, is around Rs. 150 trillion or around US$2.2 trillion at the current exchange rate. To put this is context, the size is almost the same as India’s GDP of US$ 2.17 trillion. Here are 10 Things that stand out.
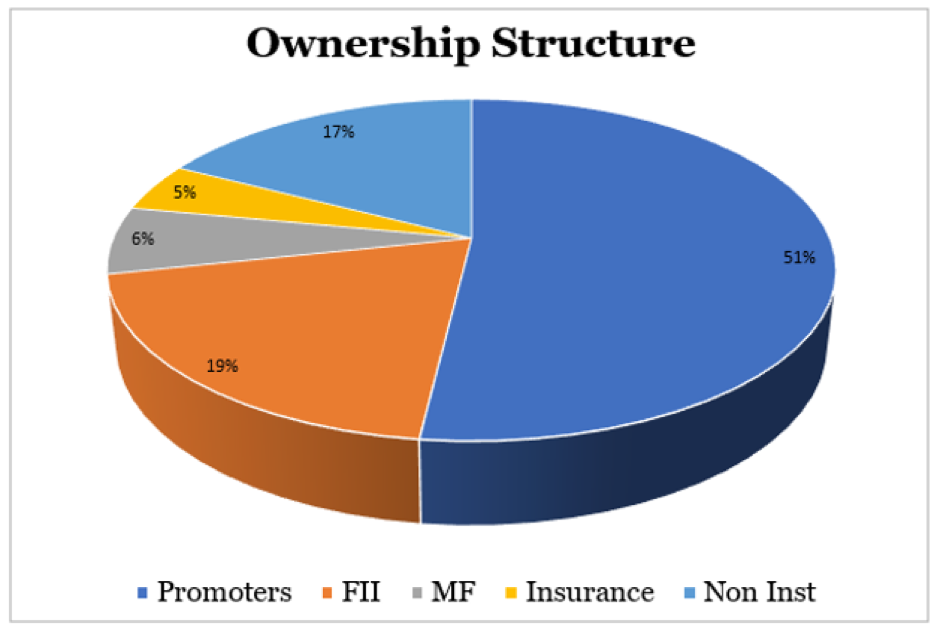
1 Promoters hold 50.8% of Corporate India. Which means 49.2% is the Free Float, or what is “available” for investors. The promoters could be Government (For PSU’s), Private Sector or Multinational Companies. By nature Promoter holding is the most stable and the playing field, for us an Investors, is really the Free Float. The current size of this is Rs. 73.7 trillion or US$ 1.08 trillion.
2 The FII’s are a dominant Force in India. They hold 19.3% of Corporate India. In terms of absolute number this translates to around $425 billion. If one looks at it from what is available perspective the number is very significant. FII’s own 39.3% of Corporate India’s Free Float
3 Mutual Funds are not as big as the perception. While the Inflows have grown substantially over the last couple of years, Mutual Funds only account for 6.3% of the Ownership or 12.8% of the Free Float of Corporate India.
4 Insurance Companies own about 4.5% of Corporate India. The Insurance companies include PSU Insurance companies like LIC, GIC and also the Private Sector ones. The Insurance companies typically hold for Long term. Many a times institutions such as LIC have played a big role in stabilising the market when it moves to extremes.
5 The Non-Institutional ownership, which is mostly the retail investors like you and me, is thus limited to 17% or 35% of the Free Float. In terms of absolute numbers this translates into around Rs. 25.4 trillion.
How do these numbers look for various Market Cap groups?
I have divided the companies into various market cap groups to see if there is a pattern. Our definition of large cap is Market Cap > Rs. 20,000 cr, Mid Cap is between Rs. 5,000 cr and Rs. 20,000 cr, Small Cap is between Rs. 1,000 cr and Rs. 5,000 cr and Micro Cap is less than Rs. 1000 cr. The table bellows shows the ownership structure for each of these categories.
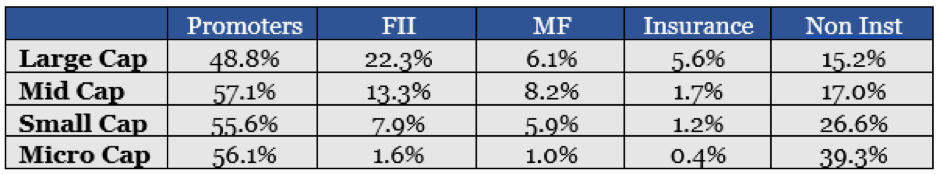
6 FII’s have an even larger share in the large cap companies. FII’s hold almost 44% of the Free Float of large cap companies. Other than the promoters, they are the biggest player in the large cap space. Their share progressively comes down as market cap decreases.
7 Mutual Funds hold 8.2% of Mid Cap companies compared to 6.1% ownership in the larger companies. Thus Mutual Funds seem to prefer participating in the Mid-Cap space. They are however still smaller than the FII’s in all the categories. But as Mutual Funds grow their clout will only go up.
8 Insurance companies mainly own large cap companies. This may be because of their perception that large cap companies are less risky. Their clout in companies other than Large cap is minimal.
9 The average institutional holding for Small Cap companies is 15%. To that extent even these smaller companies are being actively tracked by Professional Investors.The average institutional holding in Micro Cap companies is 3%.
10 The Non-Institutional ownership is the largest non-promoter holding in all Categories other than the Large Cap. But not surprisingly, the share increases as the companies get smaller. While the “playing field” gets better for retail investors when the Institutional ownership is low, it also makes such companies more vulnerable to price manipulation.
While the above findings are interesting in themselves, I would also like to highlight two important takeaways:
A. Given the dominance of FII’s it should not come as a surprise that the Indian markets track the global markets so closely as I had observed here. This is especially true for the Large Cap Companies. Also, as Mutual Fund and Insurance companies grow, hopefully the relative dominance of FII’s will reduce. Till then, at least for short term active investing, we need to keep a close eye on what is happening in the rest of the world.
B. There are around 1700 companies with Market Cap greater than Rs. 100 cr. Almost 1400 companies have some institutional holdings. Institutional ownership even in the smaller companies gives comfort. But when a company is owned by an institution it is tracked more closely by them. The fact these stocks are closely tracked also means that beating the market is that much more difficult and it requires discipline and research to level the playing field.
In my next piece. I will look at the “player” called FII’s in a bit more detail.
Would love to hear your feedback.
Note to Investors: One of our goals at Marketsmojo is to make the playing field more level by empowering every investor with the necessary tools.

Sanjeev Mohta
Market Expert
Sanjeev Mohta is the Market Expert at Marketsmojo. He has over 27 years’ experience in Investment Research and Fund management across Asian Markets and Asset classes. He has worked in various organisations in Singapore and India like Alchemy, QVT, Jefferies, ABN Amro and HSBC Securities. He Has a PhD in Economics from Tulane University, USA.