In the piece “Global recovery helped Indian markets in 2017. What about 2018?” I pointed out that the global markets have played a very important role in what happens to the Indian market.
The US markets, being the biggest of them all, has had a particular impact. Since 2008, the relationship has become much stronger as global monetary policy has played a large role in the flow of money to equity markets.
Consider this: since the Financial crisis bottom 9 years ago on March 9th, 2009 Sensex is up 308%. The US Market Bottomed out on the same day! S&P 500 is up 305% in the same period. Uncanny but true.
So, it is important to keep an eye on what is happening globally.
In the piece mentioned above, I had said that according to most economists the broad based global growth will continue in 2018. But some financial analysts and economists are now questioning that premise.
The flattening Yield Curve
A recent Wall Street Journal article said: “The differential between short- and long-term U.S. Treasury yields, which tends to grow and shrink alongside the economy’s prospects, was recently at its smallest in more than a decade.”
There has been a growing worry about yield curve in the financial press over the last few days:
A CNN Money headline on March 28th, 2018 said, “What’s a flattening yield curve and why it may be scary”
A Marketwatch headline on the same date said: “Yield curve flattens as gap between 2-year yield and 10-year yield falls to post-crisis low”
Why is so much hue and cry made about the Yield Curve?
The importance of US Treasury Yield Curve as an economic indicator
So what is a yield curve?
According to Investopedia, “the yield curve is a line that represents the relationship between short- and long-term interest rates, specifically in government securities.”
In general, short-term bonds carry lower yields than the long term bonds reflecting the view that an investor should be paid more for the “Risk” of longer term time commitment. This implies that the yield curve in general is a positively sloped line. A yield curve in a way also measures what the bond market is telling us about the risk of the time commitment.
When the Economy is expected to grow, the interest rates tend to go up, thus the difference between longer term yields and shorter-term yields are high. However, if the Economy is expected to slow down, longer term interest rates are expected to fall which would result in a smaller difference between the short-term interest rates and the longer-term interest rates. A yield curve thus can be a good indicator of the future direction of the economy. According to New York Fed, “research beginning in the late 1980s documents the empirical regularity that the slope of the yield curve is a reliable predictor of future real economic activity.”
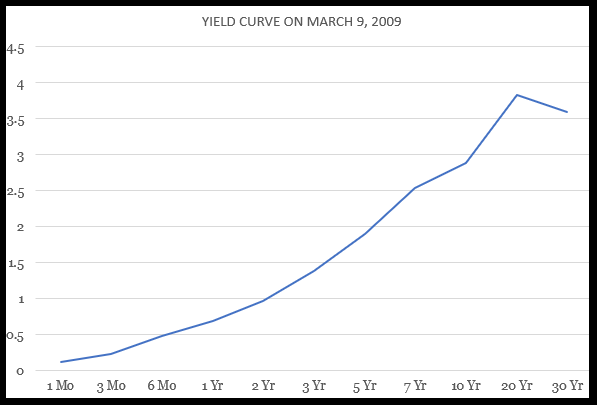
Sure enough, a steep yield curve is generally seen at the beginning of a period of economic growth. The chart below depicts the positively sloped yield-curve on March 9th, 2009, the day when the US (and the Indian) stock markets bottomed out. This was a beginning of a long period of growth for the US Economy.
Having said this, the yield curves have primarily been used as one of the key predictor of recessions. According to an article in Bloomberg a month ago, “A negative curve, where the return to investors on shorter-dated securities is above that on longer-term bonds, has predicted all nine U.S. recessions since 1955, with a lag of six to 24 months.”
What is the Yield Curve telling us at this point ?
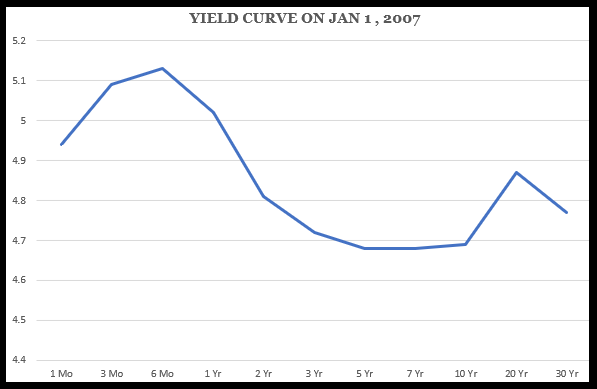
Below is the chart that depicts an inverted yield curve on Jan 10th, 2007. This was the day when the US markets peaked as a precursor to the recession driven by the Global Financial Crisis.
The chart below compares the yield curve on March 9th, 2009 (orange line) which is when the current Bull market began and the yield curve on April 6th, 2018 (Blue Line).
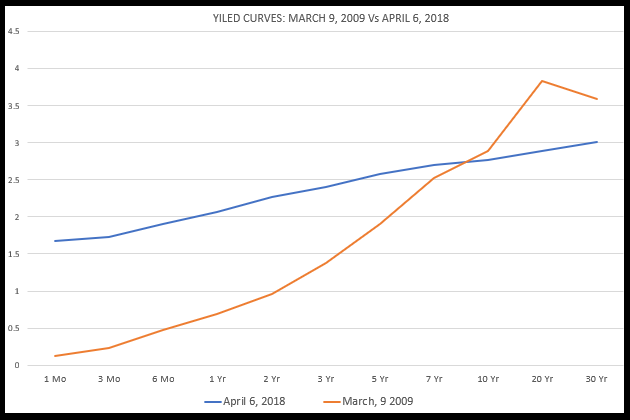
As can be seen, the current curve is much flatter than the one 9 years ago. Interestingly, the flattening of the curve has happened with the short-term yields moving up and the longer- term rates having fallen. This is exactly what the articles mentioned above highlight.
Sure enough, there are other signals which are flashing amber:
- Copper prices which are a good indicator of global growth has fallen around 7% this year.
- The stock market reached its peak on Jan 21st and now down 9% from its high
- Some of the economy related stocks have been falling faster than the market
- Recent German growth data was also not good.
- US labour data on Friday was a bit softer than what the market expected.
- Economists are also worried about the potential impact of Trump’s tariffs on growth in global trade and hence on global growth.
The fact that most of these data points are what is called “high frequency data” one need not worry too much as they can change pretty fast. Also, the good news with Yield Curve is that it is only flattening and not “Inverted”. The flattening yield curve is not a strong enough economic indicator.
But let’s be rest assured, Yield Curve will be keenly watched.
What does all this mean for India?
Given that the global markets, especially the US markets, have an impact on our markets we need to keep an eye on what is happening globally.
If the yield curve flattens further how will the Indian markets react? While lower yield will be positive for India but if the US markets were to fall sharply due to a higher probability of a slowdown it would definitely have a negative impact on India.
Also, in Optimism Interrupted.. Part 2, I had highlighted that in the short term- India has its own issues.
From a stock picking perspective, a potential slowdown in the US, some globally linked stocks, like commodity and metal producers, could get impacted as the price of the commodities depends a lot on global demand-supply. To prepare for a scenario where the chances of a global slowdown increases, it may be better to bolster the portfolio with stocks that would benefit from themes which are domestically driven.
Some examples of themes that may play out and will be less impacted by a global slowdown are:
- Government spending on Infrastructure
- Move from unorganised to organised due to Demonetisation and GST
- Rural Theme. (Read More)
- Private Sector Banks and Finance companies gaining market share from the Public-Sector Banks. (Read More)
Here is a list of 5 stocks which can be good additions to a portfolio to reduce volatility due to global factors like a flattening Yield Curve.
The common factors in these stocks are:
- Quality which is Good or Excellent
- Valuation which is Fair, Attractive or Very Attractive
- Financial Trend which is Positive, Very Positive or Outstanding
- Stock has a market cap of at least Rs. 5000 cr.
- Sectors which I believe can gain from one of the above themes.
|
Look forward to your views and comments.

Sanjeev Mohta
Market Expert
Sanjeev Mohta is the Market Expert at Marketsmojo. He has over 27 years’ experience in Investment Research and Fund management across Asian Markets and Asset classes. He has worked in various organisations in Singapore and India like Alchemy, QVT, Jefferies, ABN Amro and HSBC Securities. He Has a PhD in Economics from Tulane University, USA.