Technicals are commonly used to figure out the direction of the markets and individual stocks.
Wouldn’t it be interesting if we could find if the technical and fundamentals are actually in sync?
I have tried to do exactly that in this piece.
First the Overall data
I have used 50 day and 200 day moving averages to analyze the technical trend. Of all the stocks with market cap of more than Rs.1000 cr which have data on moving averages:
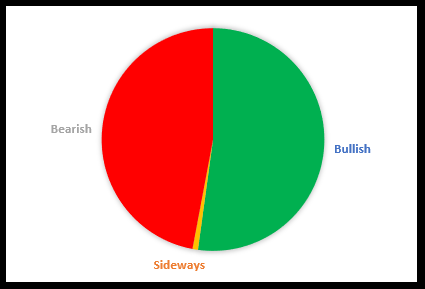
52% are showing a bullish or mildly bullish trend
45% are showing a bearish trend
The rest are showing a sideways trend
Mixing the Short Term Fundamentals with the Technicals
Now for the interesting part. I try to find if there is any correlation between the Short Term Fundamentals and the Technicals. The best parameter for the Short Term Fundamentals, according to us, is the Financial Trend.
The results are amazing.
The chart below shows the proportion of stocks in each category of Financial trend which have Positive, Sideways or Negative Technicals.
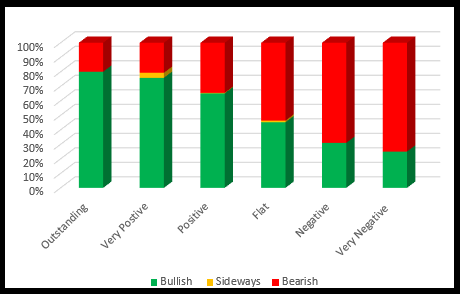
80% of stocks which have Outstanding Financial Trend have Positive Technical Trend.
76% of stocks which have Very Negative Financial Trend have Negative Technical Trend.
The trend is pretty clear from the chart above.
What does this mean?
First and foremost, the data confirms our belief that Financial Trend is a very important Short Term driver of the stock price.
Also, Technicals are signaling that the past Financial trend of most of the companies will continue. This is important as we are at the beginning of a new results season.
Another interesting analysis that can be done using the same data is to find where is the conflict.
For the stocks which have a conflict in the directions of Technicals and Financial Trend, the market may be suggesting that the Financial Trend could change.
|
I am sure you are already aware that
Each company’s latest Financial Trend can be found in the Dashboard for that company. We calculate the Financial Trend of a stock each quarter when they announce their financial result.
Now, you can easily find the stocks with highest Financial Trend and many Investment Themes based on this parameter at our brand new offering MojoProfessional™
By the way, you can also do the above analysis using these same tools.

Sanjeev Mohta
Market Expert
Sanjeev Mohta is the Market Expert at Marketsmojo. He has over 27 years’ experience in Investment Research and Fund management across Asian Markets and Asset classes. He has worked in various organisations in Singapore and India like Alchemy, QVT, Jefferies, ABN Amro and HSBC Securities. He Has a PhD in Economics from Tulane University, USA.