How can we help?
Call us, email us or come over to meet us
Send us a message

Your contact details

Name

Please Enter your Name {{namemsg}}

Email

Please Enter Email Invalid Email {{emailmsg}}

Mobile (We will use this contact number in case we need to reach you)

Please Enter Your Mobile {{mobilemsg}}

(We will use this contact number in case we need to reach you)

What can we help you with?

{{msg}}

On what topic/section?

Dear Demo,

Which topic/section do you want to report an error on ?

Which topic/section do you want to give us a suggestion

Which topic/section do you want to report an query on ?

Topics

Sections

Mojo Professional Services

Mojo Infinity

{{sectionmsg}}

Post your {{feed.type | lowercase}} on {{sectionName | lowercase}}

Dear Demo,

We have a list of queries related to {{sectionName}}. Do read through these first.

Post a message

{{suggestionmsg}}

Attach file

{{feedattachmsg}}

File size should not exceed 10 MB

Only *.doc, *.xls, *.jpg, *.png, *.pdf, *.ppt files allowed

{{feed.attach.name}}

FAQs

How is a stock analysed on MarketsMojo?

  • Here is how MarketsMojo evaluates every company

    Each company is evaluated across multiple parameters and our final call on the stock is crystalized as the Score and Call on the company.
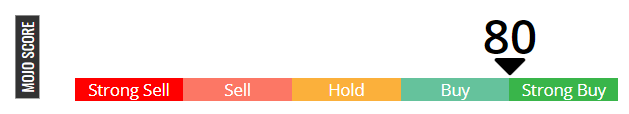
    Mojo Score

    Every company is rated on a scale of 0 to 100, with higher the score the better. The Score is accompanied with our call on the stock which has a scale across

    • Strong Buy
    • Buy
    • Hold
    • Sell
    • Strong Sell

    To arrive at the Mojo Call on a stock, we look at 4 key Dot parameters of

    • Quality: Long Term Fundamental Strength
    • Valuation: Attractiveness of the stock at the current price and multiples
    • Financial Trend: Latest results trend
    • Technicals: Near term price and volume momentum

    Quality: Long Term Fundamental Strength

    We believe High Quality companies are the ones which demonstrated strong fundamentals consistently over a long period. Quality has three major groups

    • Growth: Long Term growth in sales, operating profit and net profit
    • Capital Structure: Suitability of company’s debt measured and debt serviceability. For banks this is measured using capital adequacy ratios
    • Management Risk: Company’s ability to deliver return on its capital over a long period of time, coupled with market linked factors to determine whether the profits are real like dividend payouts, tax payout etc. We also give importance to institutional holding and holdings by domestic funds.

    Quality Grades- Companies are rated on the below scale

    • Excellent
    • Good
    • Average
    • Below Average

    Valuation: Attractiveness of the stock at the current price and multiples

    We believe a company with stronger fundamentals can justify higher valuation multiples but a company with weak fundamentals cannot even justify lower multiples. In our relative valuation measure we look at the below key parameters

    • Fundamental valuation: By looking at the relationship of the fundamental variable and valuation multiple we arrive at the regression equation to calculate where the company at its current fundamentals should trade. We adjust this derived number for the company’s sector and its own growth and debt levels. We then compare where the company is trading vs where it should trade.
    • Past Valuation: We measure the difference in the premium / discount which the company is trading at vs its own past
    • Other Factors: Other key factors are company’s PEG, Dividend Yield (upgrade) and Extreme valuations (downgrade)

    Valuation Grades- Companies are rated on the below scale

    • Very Attractive
    • Attractive
    • Fair
    • Expensive
    • Very Expensive
    • Risky

    Financial Trend: Latest results trend

    Financial trend looks at the latest results of the company and measures the momentum in the key financial parameters. It looks at various parameters across periodic results, annual profit and loss, balance sheet, shareholding (ownership) and cash flows.

    For instance, trend in quarterly revenues would incorporate the growth rate, the trajectory of growth, consistency of growth etc.

    Financial Trend Grades- Companies are rated on the below scale

    • Outstanding
    • Very Positive
    • Positive
    • Flat
    • Negative
    • Very Negative

    Technicals: Near term price and volume momentum

    Technicals look at the near-term price and volume momentum. Through Technicals we try to catch the underlying trend in the stock, and combine it with fundamentals of the company for better timing decisions.

    We look at the below parameters

    • MACD- weekly and monthly
    • Bollinger Bands- Weekly and Monthly
    • RSI- weekly and monthly
    • KST- weekly and monthly
    • OBV- weekly and monthly
    • Dow Theory- weekly and monthly
    • Moving average- Daily

    Dot Combinations and Final Score

    Once a company is evaluated on the 4 dots, relative importance to each dot to arrive at the final Mojo score is determined using a dynamic model which monitors the relative importance to be given to each dot and modify the weights when necessary.

How is Debt to Equity ratio calculated?

To calculate Debt to Equity we use Net Debt and divide it by the Book Value of the company. For Net Debt we deduct cash and marketable securities from total outstanding debt

What is the source of company news?

We currently aggregate news from across the web. We curate news periodically from across multiple news agencies and present the headlines. To read the articles you will be redirected to the news site.

How do you calculate Beta of a stock?

We compare the stock price movement against Sensex movement over the last 1 year. Beta of the stock can be viewed in the Returns section on the stocks page.

When is shareholding updated on the site?

Shareholding pattern is declared by the companies on a quarterly basis.

How do you calculate PE ratio of a stock?

To calculate PEG we divide PE ration with 1 year profit growth, trailing twelve months (TTM) To calculate PE ratio of a company we divide the Market Cap of the company with TTM profit of the company. We use consolidated profits wherever available. From profits we remove one time exception items (tax adjusted).

How do you calculate PEG ratio of a stock?

While calculating PE its the current market cap divided by trailing twelve-month (TTM) profits. PEG we use the PE ratio of the company and divide by 1 year EPS growth

How is valuation calculated?

  • We believe a company with stronger fundamentals can justify higher valuation multiples but a company with weak fundamentals cannot even justify lower multiples. In our relative valuation measure we look at the below key parameters
    • Fundamental valuation: By looking at the relationship of the fundamental variable and valuation multiple we arrive at the regression equation to calculate where the company at its current fundamentals should trade. We adjust this derived number for the company’s sector and its own growth and debt levels. We then compare where the company is trading vs where it should trade.
    • Past Valuation: We measure the difference in the premium / discount which the company is trading at vs its own past
    • Other Factors: Other key factors are company’s PEG, Dividend Yield (upgrade) and Extreme valuations (downgrade)
  • What does the technical graph represent?

    The graph represents our overall technical score which is derived from weekly/monthly and daily (moving average) parameters. It shows at which level our technical call on the stock changed.

    You can get graphs and details of each of the parameters by clicking on View Details button next to the Header (Technical Trend)

    Can an expensive company be rated Buy?

    Mojo Call is derived using 4 dots together - Quality, Valuation, Financial Trend and Technical. However, even if a company has 3 positive parameters, the company can still be rated a Buy or Strong-Buy with an expensive valuation.

    What does the valuation meter represent?

    Valuation snapshot (meter) displays the price ranges at which the valuation grade of the company would change. The valuation meter may not be available in some scenarios like, due to intraday movement the valuation grade would change basis the meter, or valuation grade remains same for a very big range.

    How is the weight to individual dot decided when calculating Mojo Score?

    We use a dynamic model which allocates weight to each dot basis the parameter by looking at overall success rate, performance of each grade and model portfolio performance.

    Which companies are Not Rated on MarkesMojo?

    Currently we do not rate Insurance and holding companies. We are creating a model to rate these companies and will have ratings of these in the near future. Apart from these new companies where we do not have enough data for our analysis, companies with erratic trading behaviour or very small companies which do not meet our minimum threshold are not rated.

    What is the target price and stop loss for the calls?

    We do not have target price or stop loss for our calls. As long as the company has a high Mojo Score derived from its fundamentals and techncials, we will continue to maintain a high rating on the company.

    What is the holding period for the calls?

    We do not have a fixed holding period for our calls. As long as the company has a high Mojo Score derived from its fundamentals and techncials, we will continue to maintain a high rating on the company.

    Why are IPOs not listed?

    To evaluate a stock, we need a minimum tenure of history of financial results and price movement. Once the stocks are listed and have been trading for a minimum number of days and have declared the required number of results, our model automatically starts rating these

    How is Corporate Governance of a company assessed?

    Corporate Governance is captured in the quality section as methodology uses multiple long-term data points across Business Quality and Management Quality and takes into account factors like Growth, Efficiency and Capital Structure.

    How do you incorporate impact of news on the company’s rating?

    We do not consider news in our analysis. Our methodology works on a big data analysis engine and we works with the fundamentals and market (price and volumes) data of the company. News may or may not impact the stock price, we will update our rating when the impact reflects in the financials or price movement.

    How to add stocks to my portfolio?

    • If you wish to upload portfolio directly, you have to click on Add option under Portfolio section and then click on Import stocks, select Broker's name for example ICICI direct and then continue, you will get demo videos of how to upload the file here.

      • Select Import Stocks for Bulk Upload
      • Select the source from which you want to import
      • You can choose the MarketsMojo format or the other available formats
      • Download the file from the source site, for help you can use the demo videos where available
      • Upload the file
      • Verify the transactions and Click on Save to Portfolio
      • Please note you can upload up to 500 transactions at one time

      Click on the image to watch the demo

      If you wish to upload it manually, you can select the Search & Add stocks option. Kindly note that you can upload 500 transactions at a time. In case if it is more than that you must upload it part by part.

      Click on the image to watch the demo

      To Add Stocks Manually

      • Select the account in which you want to make the changes
      • Click on Add
      • Select Search and Add to add stocks individually
      • Search the stock
      • Enter the details of Quantity, Investment Date and Investment Price
      • To continue adding stocks click on Add More Stocks
      • Click on Save To Portfolio to add the stocks to the portfolio

    How do I make changes to my portfolio stocks?

    Edit Transactions

    • Click on More and Choose Edit Stocks
    • Choose the stock and modify the details
    • To remove the entry click on Remove
    • Click on Save to insert the changes
    • You can also edit your current holdings by clicking on Edit below the stock name in the Portfolio Tracker

    Click on the image to watch the demo

    Sell Transactions

    • Click on More and Choose Sell Stocks
    • Choose the stock and update the details
    • Click on Save to insert the changes
    • You can also Sell your current holdings by clicking on Sell below the stock name in the Portfolio Tracker

    Where do I see my transaction history in portfolio?

    You can see all the buy and sell transaction and realized gain amount (profit) from selling a particular stock under Transaction Listing. You have to go to more options under portfolio section and choose transaction listing option you will get all the details.

    You can check Profit and Loss of your portfolio from inception under your holdings section, you can see P&L % from Unrealized gain column. The percentage that you see is your profit.

    What is composite index and how is it calculated?

    As every portfolio is unique, we create a customized benchmark index basis your portfolio allocation to Large, Mid and Small/Micro cap stocks. Basis your allocations, we virtually invest your investment amount in BSE Sensex, BSE Midcap and BSE Small cap and then track the investments in these indices. The purpose of creating a composite index is so that you always have a right benchmark to compare your returns with.

    Can I make a payment directly to the bank?

    • Our Bank account details

      All Payment to be made in favour of "MOJO MARKETS PVT. LTD."

      Bank: ICICI Bank

      Bank Account: 032305003044

      RTGS/NEFT/IFSC Code: ICIC0000323, MICR No. 400229041

      Branch : Lower Parel, Trade World, B Wing, Kamla Mill Compound, S B Road, Lower Parel West, Mumbai – 400013

      Please note: Kindly send us the transaction details after the payment is done. We'll check the same from our end and activate your account.

    Can I extend my current subscription?

    If you are an existing customer, you can extend your package by subscribing to a new offer. Your new subscription period will start after the current subscription period ends.

    Where do I download my invoice?

    On the top right of the website click on your profile icon you will find the invoice in the menu.

    Do you have any Free Trial offers?

    Currently we don't have any trial offers or packages.

    Do you have any customised package?

    Currently we don't have any customized packages, we only have one all-inclusive package with all the features included in it.

    How can I get historical performance of your calls?

    In the Mojo Stocks section, you can go to the Recent Changes section. Here the stocks which are currently in the Mojo stocks or were in the past are mentioned along with their performance since the day they were added till the day they exited (or current price if stock is still in the list. The performance is compared with Benchmark in the same period.

    Are there human interventions in your rating?

    The Mojo Score is calculated automatically basis the underlying fundamental and technical analysis of the company. For a stock to qualify as a Mojo stock, it has to be approved by our Investment Committee which may reject a stock to be added to the list on grounds of corporate governance issues or continuity of business case.

    What is the target price and holding period of Mojo Stocks?

    We do not provide target price or holding period on individual stock. A stock would remain a Mojo Stock till its Fundamentals and Technicals support it and it rates as one of the highly rated stocks.

    How would I know about changes to Mojo Stocks list?

    Whenever a stock enters or exits the Mojo stocks list we send mobile app and onsite notification to our paid subscribers. We also send a weekly consolidated email on the changes to the list.

    What is Stock of the month?

    From our pool of top-rated Mojo stocks, our Chief Investment Officer (CIO) picks one stock opportunity every month which is sent to the paid subscribers of MarketsMojo on the 10th of every month. Our CIO does a qualitative assessment of this stock on top of the Mojo Score and Call to identify the top opportunity for the month. A detailed research report is also shared with our subscribers explaining the investment case in detail.

    How are mutual funds analysed?

    There are 3 Broad Factors Used for Evaluation

    • Performance: Past performance of the Fund is compared against the benchmark and peers with emphasis on consistency of returns rather so that recent periods do not unduly influence the overall rating
    • Risk: Risk measures of the fund are compared with benchmark and peers over the period. Fund’s ability to generate return per unit of risk taken is measured along with liquidity and portfolio concentration measures
    • Portfolio Strength: Strength of the portfolio by rating the underlying constituents and comparing it across the peer funds

    Factor Weight: We run multiple combinations of weights across the factors and measure the performance of each combination in terms of the success rate and performance of funds which qualify for our buckets of Buy, Hold and Sell using monthly rating update Parameters Calculated - We measure the following matrices

    • Return generated by each bucket using monthly update
    • Returns generated using annual rebalancing
    • SIP returns
    • Success rate of categories
    • Performance vs benchmark
    • Distribution of bucket returns

    Method Selection: All the methods are evaluated across the parameters and scored to arrive at the best method for each fund class. The methods are evaluated periodically to measure if a change in method is required

    How do I get the best funds across all categories?

    Currently the Mutual Funds are only analysed within their category

    I am looking at a Fund, but it is not rated, why is this so?

    We require a minimum history of 3 years to evaluate the Fund's performance and hence new funds will not be rated. Also, since the rating is within the category we require minimum number of funds in the category for the category to be rated. We are currently not rating a few categories like liquid, ultra-short-term funds, FMP etc.

    What services do I get with Mojo Professional subscription

    Once you take our subscription you will get unlimited access to all below mentioned Mojo Professional features - 

    1. STOCK SCORE – You can get Buy/Hold/Sell calls and detailed research on all listed companies, with detailed rationale and research reports
    2. MODEL PORTFOLIOS - You can invest 3 model portfolios with an impeccable track record. We will create it and track it for you. All you need to do is decide the amount you want to invest, choose your risk profile and start.
    3. MOJO STOCKS - Our most sought-after section, Mojo Stocks has the highest probability of success. If you are looking at the best stocks to buy at any time and market scenario, there is no better way to invest than to just follow Mojo Stocks.
    4. PORTFOLIO SERVICES - Upload your portfolio in seconds from any broker and this unique feature helps you to weed out underperforming companies and invest in better quality companies. We track & advise you on your portfolio 24/7.
    5. STOCK OF THE MONTH - Every 10th of the month, you will receive a handpicked stock from our CIO-Sunil Damania.
    6. SCREENERS - With our screeners you can make your own stock selection model. Our 2 powerful screeners will help you to do the same across hundreds of prechosen parameters you can pick from.
    7. VERDICT – Get real-time research reports on all listed companies. The detailed research report changes every minute, taking into account all the things that affect a stock.
    8. SwitchER – will give the best stock option to switch from your current stock and alternatives to better stocks in the same Industry/Market Cap.
    9. Mutual Fund Research - In the Mutual section all funds are ranked and given buy/hold/sell rating. While analysing a Fund not only the fund’s performance but also the strength of its portfolio is taken into consideration.

    Where can I get a demo of the Mojo Professional services?

    We would recommend you to kindly go through all the demo videos and the description to understand each feature we provide under MOJO Professional.

    You could have a look at the demo videos to understand the type of services we provide-

    Mojo Professional Demos

    I am unable to sign in with my gmail account in the login box?

    While registering you may have used your Continue with google and logged with your Google account. You need to follow the same steps while signing again. Please see the screenshot below. Click on the Sign in with Google button to log in to Marketsmojo

    I have noticed my questions don't get picked up often.

    We receive questions from more than 1000 attendees who attend our webinar. At times it does get difficult to attend each of them. Please drop in your queries in the feedback section and we will get our team to answer them for you.

    Where can I view the recordings of webinar events?

    Currently, as per company policy, we do not share our webinar recordings. However, we do repeat these webinar events and topics regularly. You could register for these events using this link https://www.marketsmojo.com/mojo/webinar

    {{feedsuccessmsg}}

    Karan Batra

    Chief Product Officer

    Your Message:

    Attachment : {{feedattachfiles.name}}

    Speak to us

    +91 22-35121238 | +91 22-35121239 | +91 22-35121240

    +91 22-35121238 | +91 22-35121239
    +91 22-35121240

    Monday to Friday (9:00AM to 6:30PM)

    Meet us
    locate us on maps

    Benefice Business House, Office No. 3B, 3rd Floor Mathuradas Mills Estate, N.M. Joshi Marg, Senapati Bapat Marg, Lower Parel, Mumbai, Maharashtra 400013

    locate us on maps

    {{global_msg.msg}}
    • Stock List
    • A
    • B
    • C
    • D
    • E
    • F
    • G
    • H
    • I
    • J
    • K
    • L
    • M
    • N
    • O
    • P
    • Q
    • R
    • S
    • T
    • U
    • V
    • W
    • X
    • Y
    • Z
    • Others
    Careers
    Contact Us
    Refund Policy
    FAQ
    Other Links
    Disclaimer
    Terms and Conditions
    Privacy Policy
    Process Disclosure
    {{subscribe_err.msg}}
    Facebook
    Twitter
    Linked in
    Email Us
    We Power Research and Services of-
    For Business Partnership, pls write to us at partnership@marketsmojo.com
    GET THE MARKETSMOJO APP

    SEBI Registered Investment Advisor Registration No: INA000012528 (Non – Ind); GST NO.27AAJCM7871R1ZD

    Corresponding SEBI Address: Investment Management Department, CIS Division, SEBI Bhavan, Plot No.C4-"A", "G" Block, Bandra Kurla Complex, Bandra (E), Mumbai – 400 051

    Principal Officer: Mr.Karan Batra, Phone : 022 – 35121238 E-mail : compliance@marketsmojo.com

    Benefice Business House, Office No. 3B, 3rd Floor, C.S. 242, Mathuradas Mills Estate, N.M. Joshi Marg, Tulsi Pipe Road, Lower Parel West, Mumbai- 400013 locate us on maps

    Copyright © 2023 Markets Mojo