
Compare ADF Foods with Similar Stocks
Total Returns (Price + Dividend) 
Latest dividend: 0.5991689750692522 per share ex-dividend date: Nov-13-2025
Risk Adjusted Returns v/s
Returns Beta

News

ADF Foods Ltd Upgraded to Buy on Improved Valuation and Financial Trends
ADF Foods Ltd has seen its investment rating upgraded from Hold to Buy, driven primarily by an improved valuation profile alongside robust financial trends and solid quality metrics. The company’s recent performance and comparative sector analysis underpin this positive reassessment, signalling renewed investor confidence in this FMCG small-cap.
Read full news article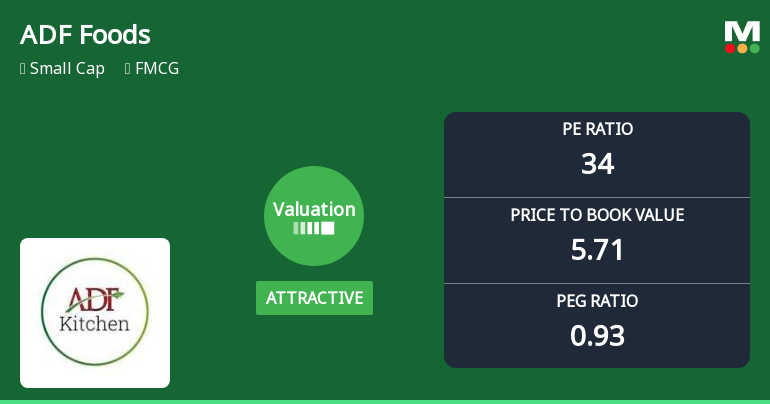
ADF Foods Ltd Valuation Shifts Signal Enhanced Price Attractiveness Amid FMCG Sector Dynamics
ADF Foods Ltd has witnessed a notable shift in its valuation parameters, moving from a fair to an attractive rating, driven by improved price-to-earnings and price-to-book value metrics. This change comes amid robust returns that have significantly outpaced the broader Sensex, signalling renewed investor interest in this FMCG small-cap stock.
Read full news article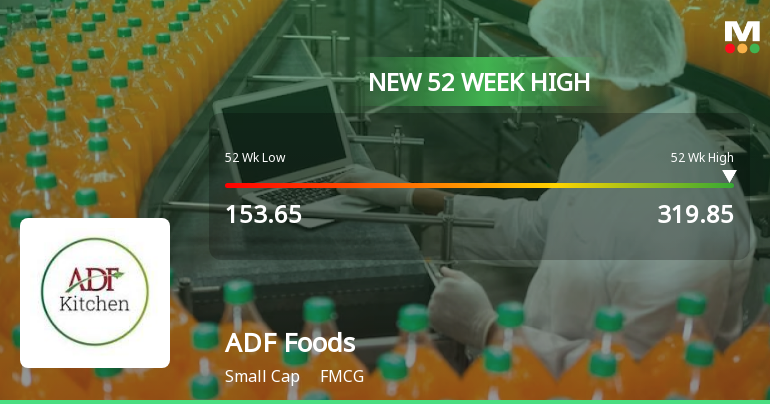
Broad-Based Technical Strength Lifts ADF Foods Ltd to 52-Week High of Rs 319.85
Rising from a 52-week low of Rs 153.65 to a fresh peak of Rs 319.85 on 22 Jun 2026, ADF Foods Ltd has demonstrated robust price momentum, outpacing the Sensex’s negative 6.3% return over the past year with a 15.76% gain. This milestone caps a five-day winning streak that has propelled the stock up by 13.21%, underscoring a sustained technical uptrend.
Read full news article Announcements
Announcement under Regulation 30 (LODR)-Newspaper Publication
18-Jun-2026 | Source : BSEIntimation under Regulation 30 & 47 of SEBI (LODR) Regulations 2015 w.r.t. newspaper publication regarding opening of Special Window for transfer and dematerialisation of physical shares.
Announcement Under Regulation 30 (LODR) - Reminder To Shareholders Holding Shares In Physical Mode To Update KYC Details.
08-Jun-2026 | Source : BSEPursuant to Regulation 30 of SEBI (LODR) Regulations 2015 please find enclosed a copy of letter dispatched to the shareholders holding shares in physical mode as a reminder to update KYC details in compliance with SEBI Master Circular dated 6th February 2026.
Compliances-Reg.24(A)-Annual Secretarial Compliance
29-May-2026 | Source : BSEPursaunt to Regulation 24A of SEBI (LODR) Regulations 2015 please find enclosed Annual Secretarial Compliance Report for the financial year ended 31st March 2026.
Corporate Actions

No Upcoming Board Meetings

ADF Foods Ltd has declared 30% dividend, ex-date: 13 Nov 25

ADF Foods Ltd has announced 2:10 stock split, ex-date: 11 Sep 23

No Bonus history available

No Rights history available
Quality key factors
Valuation key factors
Technicals key factors
 Technical Indicator Scale: Bearish, Mildly Bearish, Sideways, Mildly Bullish, Bullish Turned
 Shareholding Snapshot : Mar 2026
Shareholding Compare (%holding)
Promoters
None
Held by 2 Schemes (0.0%)
Held by 37 FIIs (11.55%)
Bimal Ramesh Thakkar (13.08%)
Authum Investment And Infrastructure Limited (15.44%)
17.67%
Quarterly Results Snapshot (Consolidated) - Mar'26 - QoQ

QoQ Growth in quarter ended Mar 2026 is 2.99% vs 17.47% in Dec 2025

QoQ Growth in quarter ended Mar 2026 is 15.77% vs -15.20% in Dec 2025
Half Yearly Results Snapshot (Consolidated) - Sep'25
Growth in half year ended Sep 2025 is 4.41% vs 19.40% in Sep 2024
Growth in half year ended Sep 2025 is 22.25% vs 13.34% in Sep 2024
Nine Monthly Results Snapshot (Consolidated) - Dec'25
YoY Growth in nine months ended Dec 2025 is 13.01% vs 17.40% in Dec 2024
YoY Growth in nine months ended Dec 2025 is 21.20% vs 6.86% in Dec 2024
Annual Results Snapshot (Consolidated) - Mar'26
YoY Growth in year ended Mar 2026 is 15.88% vs 13.31% in Mar 2025
YoY Growth in year ended Mar 2026 is 29.83% vs -8.01% in Mar 2025
About ADF Foods Ltd

Company Coordinates


