
Compare Asahi Songwon with Similar Stocks
Dashboard
Weak Long Term Fundamental Strength with a -5.30% CAGR growth in Operating Profits over the last 5 years
- Low ability to service debt as the company has a high Debt to EBITDA ratio of 2.87 times
- The company has been able to generate a Return on Equity (avg) of 4.53% signifying low profitability per unit of shareholders funds
Underperformed the market in the last 1 year
Stock DNA
Dyes And Pigments
INR 304 Cr (Micro Cap)
16.00
20
0.59%
0.51
6.91%
1.11
Total Returns (Price + Dividend) 
Latest dividend: 1.5 per share ex-dividend date: Sep-04-2025
Risk Adjusted Returns v/s
Returns Beta

News
Asahi Songwon Colors Ltd is Rated Sell
Asahi Songwon Colors Ltd is rated Sell by MarketsMOJO. This rating was last updated on 26 May 2026, reflecting a reassessment of the stock’s outlook. However, all fundamentals, returns, and financial metrics discussed here are current as of 22 June 2026, providing investors with the latest perspective on the company’s position in the market.
Read full news article
Asahi Songwon Colors Ltd is Rated Sell
Asahi Songwon Colors Ltd is rated 'Sell' by MarketsMOJO, with this rating last updated on 26 May 2026. However, the analysis and financial metrics discussed here reflect the stock's current position as of 11 June 2026, providing investors with an up-to-date perspective on the company's performance and outlook.
Read full news article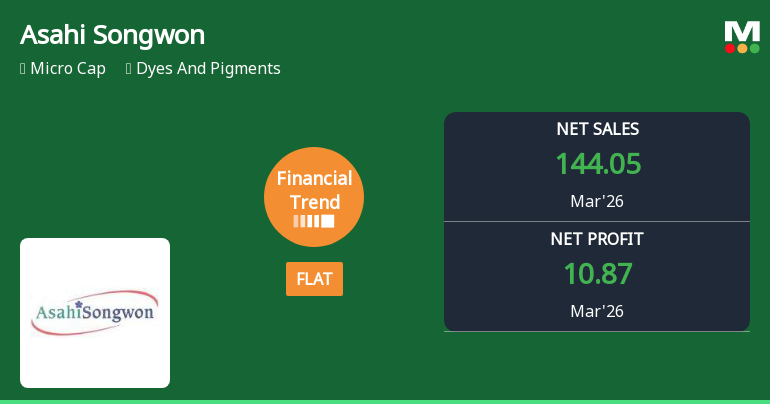
Asahi Songwon Colors Ltd Reports Mixed Quarterly Performance Amid Flat Financial Trend
Asahi Songwon Colors Ltd has delivered its strongest quarterly results in recent memory for the period ending March 2026, showcasing significant improvements in profitability and operational efficiency despite a broader flat financial trend. The micro-cap dyes and pigments company’s latest performance highlights a notable turnaround in key metrics, although its longer-term financial trajectory remains cautious amid sector challenges.
Read full news article Announcements
Announcement under Regulation 30 (LODR)-Resignation of Chief Executive Officer (CEO)
17-Jun-2026 | Source : BSEAsahi Songwon Colors Limited has submitted to the exchange additional details in relation to the Corporate Announcement filed pursuant to Regulation 30 of SEBI (LODR) Regulations 2015 regarding the resignation of Mr. Gokul M. Jaykrishna from the position of CEO of the Company.
Announcement under Regulation 30 (LODR)-Earnings Call Transcript
04-Jun-2026 | Source : BSEAsahi Songwon Colors Limited has informed the Exchange of the transcript of the Earning Call.
Announcement under Regulation 30 (LODR)-Analyst / Investor Meet - Outcome
01-Jun-2026 | Source : BSEAsahi Songwon Colors Limited has informed the exchange that the recording of Companys earnings conference call on financial performance of Q4FY26 with investors and analysts held today June 01 2026 is available on website of the Company.
Corporate Actions

No Upcoming Board Meetings

Asahi Songwon Colors Ltd has declared 15% dividend, ex-date: 04 Sep 25

No Splits history available

No Bonus history available

No Rights history available
Quality key factors
Valuation key factors
Technicals key factors
 Technical Indicator Scale: Bearish, Mildly Bearish, Sideways, Mildly Bullish, Bullish Turned
 Shareholding Snapshot : Mar 2026
Shareholding Compare (%holding)
Promoters
None
Held by 0 Schemes
Held by 1 FIIs (0.05%)
Mrugesh Jaykrishna Family Trust - I (43.93%)
Dic Corporation (7.34%)
18.7%
Quarterly Results Snapshot (Consolidated) - Mar'26 - QoQ

QoQ Growth in quarter ended Mar 2026 is 19.39% vs -0.21% in Dec 2025
QoQ Growth in quarter ended Mar 2026 is 338.31% vs 10.22% in Dec 2025
Half Yearly Results Snapshot (Consolidated) - Sep'25

Growth in half year ended Sep 2025 is -1.85% vs 39.25% in Sep 2024
Growth in half year ended Sep 2025 is -39.84% vs -52.35% in Sep 2024
Nine Monthly Results Snapshot (Consolidated) - Dec'25
YoY Growth in nine months ended Dec 2025 is -4.44% vs 36.41% in Dec 2024
YoY Growth in nine months ended Dec 2025 is -34.76% vs -32.31% in Dec 2024
Annual Results Snapshot (Consolidated) - Mar'26
YoY Growth in year ended Mar 2026 is -4.78% vs 31.94% in Mar 2025
YoY Growth in year ended Mar 2026 is -4.96% vs -1.50% in Mar 2025
About Asahi Songwon Colors Ltd

Company Coordinates


