
Compare Commerl. Synbags with Similar Stocks
Dashboard
Low ability to service debt as the company has a high Debt to EBITDA ratio of 2.68 times
- Low ability to service debt as the company has a high Debt to EBITDA ratio of 2.68 times
Poor long term growth as Net Sales has grown by an annual rate of 12.61% and Operating profit at 16.78% over the last 5 years
Flat results in Mar 26
With ROCE of 12.4, it has a Fair valuation with a 2.7 Enterprise value to Capital Employed
Despite the size of the company, domestic mutual funds hold only 0% of the company
Market Beating performance in long term as well as near term
Total Returns (Price + Dividend) 
Latest dividend: 0.4 per share ex-dividend date: Sep-22-2025
Risk Adjusted Returns v/s
Returns Beta

News
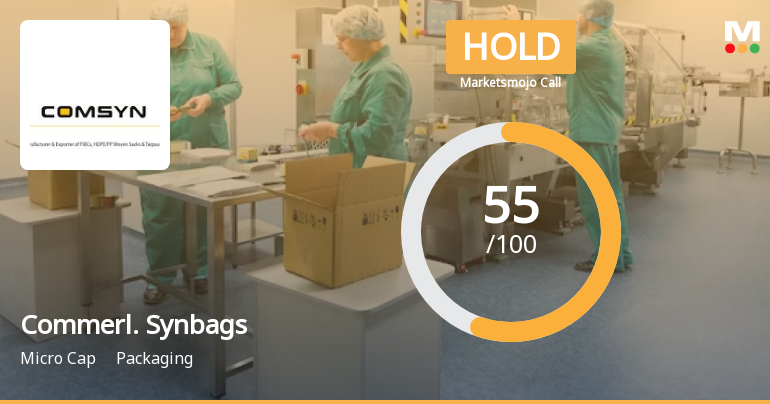
Commercial Syn Bags Ltd Upgraded to Hold on Mixed Financial and Technical Signals
Commercial Syn Bags Ltd has seen its investment rating upgraded from Sell to Hold as of 2 June 2026, reflecting a nuanced shift in its financial performance, quality metrics, valuation, and technical indicators. This article analyses the key factors behind this change, providing investors with a comprehensive understanding of the company’s current standing within the packaging sector.
Read full news article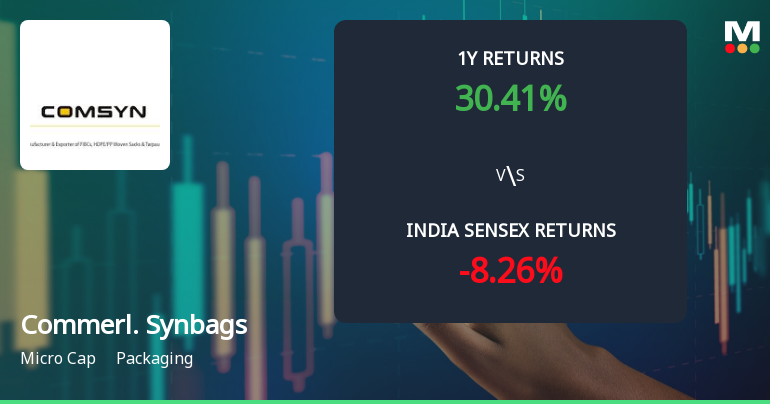
Commercial Syn Bags Ltd Shows Mildly Bullish Momentum Amid Mixed Technical Signals
Commercial Syn Bags Ltd has experienced a notable shift in its technical momentum, moving from a sideways trend to a mildly bullish stance. Despite mixed signals from key technical indicators such as MACD, RSI, and moving averages, the stock’s recent performance and upgraded rating suggest cautious optimism among investors in the packaging sector.
Read full news article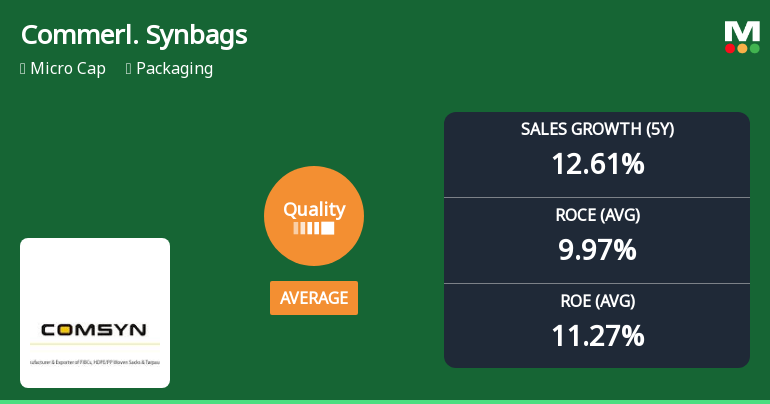
Commercial Syn Bags Ltd Upgrades Quality Grade Amid Improving Fundamentals
Commercial Syn Bags Ltd has seen a notable upgrade in its quality grade from below average to average, reflecting a positive shift in its business fundamentals. This micro-cap packaging company has demonstrated improved profitability metrics, manageable debt levels, and consistent growth, signalling a more stable outlook for investors.
Read full news article Announcements
Announcement under Regulation 30 (LODR)-Newspaper Publication
01-Jun-2026 | Source : BSEWe are pleased to submit the copy of extract on newspaper clipping of standalone and consolidated audited financial results for the quarter/year ended on 31st March 2026.
Statement On Deviation Or Variation Of Funds In Proceeds Of Preferential Issue For The Quarter Ended 31St March 2026.
30-May-2026 | Source : BSE.
Board Meeting Outcome for Submission Of The Outcome Of 1/2026-27 Board Meeting Along With Standalone And Consolidated Audited Financial Results Along With Auditors Report Thereon For The Quarter/Year Ended On 31St March 2026.
30-May-2026 | Source : BSEPursuant to Regulation 33(3)(d) of the SEBI (LODR) Regulation 2015 we are pleased to submit the Standalone and Consolidated Audited Financial Results along with Auditors Report and Statement of Assets and Liabilities and Cash Flow for the Quarter/Year ended on 31st March 2026 in PDF format which were also approved by the Audit Committee and Board of Directors at their meeting held on 30th May 2026.
Corporate Actions

No Upcoming Board Meetings

Commercial Syn Bags Ltd has declared 4% dividend, ex-date: 22 Sep 25

No Splits history available

Commercial Syn Bags Ltd has announced 2:1 bonus issue, ex-date: 25 Nov 22

No Rights history available
Quality key factors
Valuation key factors
Technicals key factors
 Technical Indicator Scale: Bearish, Mildly Bearish, Sideways, Mildly Bullish, Bullish Turned
 Shareholding Snapshot : Mar 2026
Shareholding Compare (%holding)
Promoters
None
Held by 0 Schemes
Held by 2 FIIs (0.19%)
Super Sack Private Limited (26.29%)
Praavanya Ventures Llp (5.39%)
23.1%
Quarterly Results Snapshot (Consolidated) - Mar'26 - YoY

YoY Growth in quarter ended Mar 2026 is 2.83% vs 40.44% in Mar 2025
YoY Growth in quarter ended Mar 2026 is -21.44% vs 150.62% in Mar 2025
Half Yearly Results Snapshot (Consolidated) - Sep'25

Growth in half year ended Sep 2025 is 15.55% vs 10.69% in Sep 2024
Growth in half year ended Sep 2025 is 152.80% vs 13.09% in Sep 2024
Nine Monthly Results Snapshot (Consolidated) - Dec'25
YoY Growth in nine months ended Dec 2025 is 14.57% vs 14.27% in Dec 2024
YoY Growth in nine months ended Dec 2025 is 120.77% vs 95.04% in Dec 2024
Annual Results Snapshot (Consolidated) - Mar'26
YoY Growth in year ended Mar 2026 is 11.26% vs 20.59% in Mar 2025
YoY Growth in year ended Mar 2026 is 53.74% vs 117.81% in Mar 2025
About Commercial Syn Bags Ltd

Company Coordinates


