ITC

INR
266.00
-1.4 (-0.52%)
BSENSE

Aug 28, 03:30 PM

BSE+NSE Vol: 1.61 cr

  • Price Points
  • Score
  • Mojo Parameters
  • Total Return
  • News and Corporate Actions
  • Key factors
  • Shareholding
  • Financials
  • CompanyCV
stock-summaryPrice Point
High/Low

1Day

52 Week

Valuation
Technical
Day's Volume

CASH

1.61 cr (43.56%) Volume

Shareholding (Jun 2026)

FII

34.23%

Held by 669 FIIs

DII

49.18%

Held by 1067 DIIs

Promoter

0.00%

Why is ITC Ltd. falling/rising?

29-Aug-2026

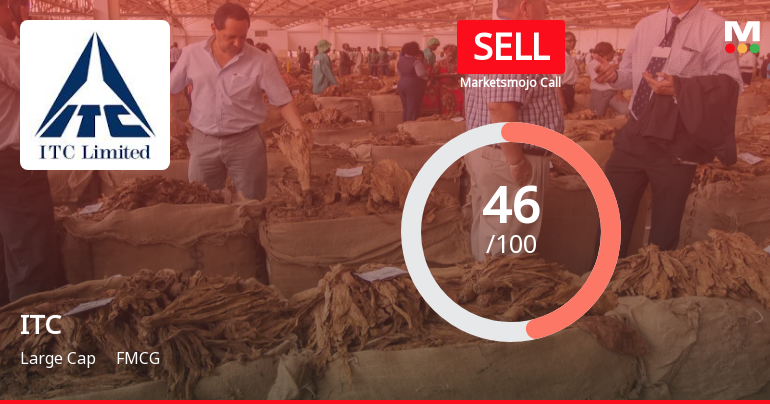
As of 28-Aug, ITC Ltd. is facing a decline in its stock price, currently at Rs. 266.00, with a total drop of -34.00% year-to-date, significantly underperforming against the benchmark index. Despite strong long-term fundamentals, recent negative financial results have led to decreased investor interest and a bearish trend in the stock.

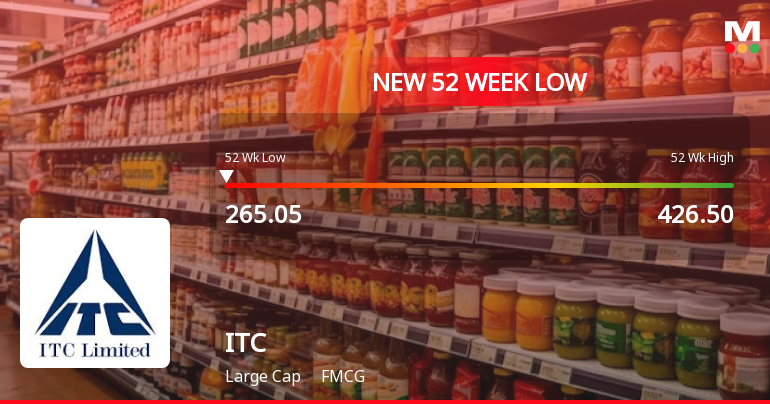
As of 28-Aug, ITC Ltd. is experiencing a decline in its stock price, currently at Rs. 266.00, which reflects a change of -1.4 (-0.52%). The stock has been on a downward trend, having fallen for the last three consecutive days, resulting in a total decline of -1.85% during this period. Additionally, the stock has reached a new 52-week low of Rs. 264.9 today.<BR><BR>The performance of ITC Ltd. has been notably poor over various time frames, with a year-to-date decline of -34.00% compared to a -9.34% decline in the benchmark index, Sensex. Over the past year, the stock has generated a return of -33.62%, significantly underperforming against the BSE500 in each of the last three annual periods. This consistent underperformance is a critical factor contributing to the stock's decline.<BR><BR>Moreover, ITC Ltd. is trading below its moving averages across multiple time frames, including the 5-day, 20-day, 50-day, 100-day, and 200-day averages, indicating a bearish trend. Investor participation has also decreased, with delivery volume dropping by -32.8% against the 5-day average, suggesting waning interest among investors.<BR><BR>While the company maintains strong long-term fundamentals, such as a high return on equity and a net-debt-free status, recent negative financial results, including a -22.2% fall in profit after tax and an -11.07% decline in net sales, have raised concerns. These factors collectively contribute to the stock's current downward trajectory.

View full answer

Should I buy, sell or hold ITC Ltd.?

18-Aug-2026

Who are in the management team of ITC?

14-Aug-2026

The management team of ITC includes Chairman & Managing Director Sanjiv Puri, Executive Director Nakul Anand, Whole-time Directors Sumant Bhargavan and Supratim Dutta (CFO), along with several independent directors and other board members. Rajendra Kumar Singhi serves as the Company Secretary and Compliance Officer.

The management team of ITC includes the following key members:<BR><BR>1. **Sanjiv Puri** - Chairman & Managing Director<BR>2. **Nakul Anand** - Executive Director<BR>3. **Sumant Bhargavan** - Whole-time Director<BR>4. **Supratim Dutta** - Whole Time Director & CFO<BR><BR>Additionally, the board features several independent directors, including:<BR><BR>- **Meera Shankar**<BR>- **S Banerjee**<BR>- **Arun Duggal**<BR>- **Nirupama Rao**<BR>- **Ajit Kumar Seth**<BR>- **Anand Nayak**<BR>- **Hemant Bhargava**<BR>- **Shyamal Mukherjee**<BR><BR>There are also directors such as:<BR><BR>- **David Robert Simpson**<BR>- **Mukesh Gupta**<BR>- **Sunil Panray**<BR>- **P. R. Chittaranjan** (who holds a position as a director)<BR><BR>Rajendra Kumar Singhi serves as the Company Secretary and Compliance Officer. This diverse team brings a wealth of experience and expertise to the company.

View full answer

What does ITC do?

14-Aug-2026

ITC Ltd. is a leading Indian FMCG company established in 1910, with a market cap of INR 347,317 Cr, net sales of 19,114 Cr, and a net profit of 4,394 Cr as of June 2026. Key metrics include a P/E ratio of 18.00, a dividend yield of 5.24%, and a return on equity of 28.83%.

Overview: <BR>ITC Ltd. is one of India's foremost private sector companies with a diversified presence in the FMCG industry, categorized as a Large Cap.<BR><BR>History: <BR>ITC was incorporated in the year 1910. The latest quarterly results reported are for June 2026, showcasing significant sales and profit figures.<BR><BR>Financial Snapshot: <BR>Most recent Net Sales: 19,114 Cr (Quarterly Results - Jun 2026) <BR>Most recent Net Profit: 4,394 Cr (Quarterly Results - Jun 2026) <BR>Market-cap value: INR 347,317 Cr (Large Cap)<BR><BR>Key Metrics: <BR>P/E: 18.00 <BR>Industry P/E: 18 <BR>Dividend Yield: 5.24% <BR>Debt-Equity: -0.29 <BR>Return on Equity: 28.83% <BR>Price to Book: 4.78<BR><BR>Contact Details: <BR>Address: Virginia House, 37 Jawaharlal Nehru Road, Kolkata, West Bengal: 700071 <BR>Tel: 91-033-22889371 <BR>Email: enduringvalue@itc.in <BR>Website: http://www.itcportal.com

View full answer

Who are the peers of the ITC?

14-Aug-2026

ITC's peers include Hind. Unilever, Nestle India, Britannia Inds., Tata Consumer, Godrej Consumer, Dabur India, Colgate-Palmoliv, Cupid, Godfrey Phillips, and P&G Hygiene, with Nestle India showing the highest 1-year return at 36.43% and ITC the lowest at -32.49%. Most peers maintain excellent capital structures, with varying management and growth ratings.

Peers: The peers of ITC are Hind. Unilever, Nestle India, Britannia Inds., Tata Consumer, Godrej Consumer, Dabur India, Colgate-Palmoliv, Cupid, Godfrey Phillips, and P&G Hygiene.<BR><BR>Quality Snapshot: Excellent management risk is observed at Hind. Unilever, ITC, Nestle India, Britannia Inds., Colgate-Palmoliv, and Godfrey Phillips, while Average management risk is found at Tata Consumer and Cupid, and Good management risk is noted at Godrej Consumer and Dabur India. Growth is rated as Good for Nestle India and Tata Consumer, while Below Average growth is seen at Hind. Unilever, ITC, Britannia Inds., Godrej Consumer, Dabur India, and Colgate-Palmoliv, with Cupid showing Good growth and Godfrey Phillips exhibiting Excellent growth. All peers maintain an Excellent capital structure.<BR><BR>Return Snapshot: The peer with the highest 1-year return is Nestle India at 36.43%, while the lowest is ITC at -32.49%, indicating that ITC's return is significantly lower than its peers. Additionally, peers such as Godrej Consumer, Dabur India, Colgate-Palmoliv, Godfrey Phillips, and P&G Hygiene have negative six-month returns.

View full answer

How big is ITC?

14-Aug-2026

As of 14th August, ITC Ltd. has a market capitalization of 347,442.15 Cr, with recent net sales of 76,487.98 Cr and a net profit of 19,839.40 Cr.

As of 14th August, ITC Ltd. has a market capitalization of 347,442.15 Cr, categorizing it as a Large Cap company.<BR><BR>In the latest four quarters, ITC reported Net Sales of 76,487.98 Cr and a Net Profit of 19,839.40 Cr.<BR><BR>The latest annual period for the balance sheet is March 2026, with Shareholder's Funds amounting to 72,507.30 Cr and Total Assets of 93,637.20 Cr.

View full answer

Are ITC Ltd. latest results good or bad?

22-May-2026

ITC Ltd.'s latest results show strong profitability with a net profit increase of 9.26% and operating margins at a high of 39.28%. However, net sales fell by 11.09% sequentially and 5.01% year-on-year, raising concerns about revenue sustainability in a challenging market.

ITC Ltd.'s latest results present a mixed picture. On one hand, the company demonstrated strong profitability improvements, with a net profit of ₹5,388 crores, reflecting a 9.26% increase quarter-on-quarter. This was supported by a significant expansion in operating margins, which reached 39.28%, the highest quarterly figure in recent times.<BR><BR>However, the topline performance was concerning, as net sales fell by 11.09% sequentially and contracted by 5.01% year-on-year, marking the lowest quarterly revenue in the trailing twelve months. This decline in sales indicates challenges in maintaining volume growth amidst broader consumption headwinds affecting the FMCG sector.<BR><BR>Overall, while ITC's profitability metrics are impressive and suggest effective cost management, the revenue decline raises questions about the sustainability of growth in a challenging market environment. Investors may view the results as good in terms of profitability but concerning regarding revenue trends.

View full answer

Is ITC technically bullish or bearish?

05-Dec-2025

As of December 4, 2025, the trend is mildly bearish, supported by daily moving averages and weekly Dow Theory, despite some mixed signals from the MACD and Bollinger Bands.

As of 4 December 2025, the technical trend has changed from bearish to mildly bearish. The current stance is mildly bearish, driven by the daily moving averages indicating bearish momentum and the weekly Dow Theory also reflecting a mildly bearish outlook. The MACD shows a mildly bullish signal on the weekly chart but is mildly bearish on the monthly, suggesting mixed signals. The Bollinger Bands are sideways on the weekly and bearish on the monthly, further supporting the bearish sentiment. Overall, while there are some mildly bullish indicators, the prevailing trend remains bearish.

View full answer

How has been the historical performance of ITC?

02-Dec-2025

ITC has demonstrated consistent growth in net sales and profits, with net sales rising from ₹49,272.78 Cr in Mar'21 to ₹75,323.34 Cr in Mar'25, and consolidated net profit increasing to ₹34,746.63 Cr in Mar'25. However, profit after tax slightly declined from ₹20,176.39 Cr in Mar'24 to ₹19,926.05 Cr in Mar'25.

Answer:<BR>The historical performance of ITC shows a consistent growth trajectory in net sales and profits over the years, with significant fluctuations in certain metrics.<BR><BR>Breakdown:<BR>ITC's net sales have increased from 49,272.78 Cr in Mar'21 to 75,323.34 Cr in Mar'25, reflecting a strong upward trend. Total operating income followed a similar pattern, rising from 49,272.78 Cr in Mar'21 to 75,323.34 Cr in Mar'25. The raw material costs also increased, reaching 23,757.33 Cr in Mar'25, up from 13,939.84 Cr in Mar'21. Operating profit (PBDIT) has shown growth, reaching 28,507.90 Cr in Mar'25 compared to 19,635.26 Cr in Mar'21. Profit before tax has also risen significantly, from 17,945.09 Cr in Mar'21 to 26,816.52 Cr in Mar'25. However, profit after tax saw a slight decline from 20,176.39 Cr in Mar'24 to 19,926.05 Cr in Mar'25. The consolidated net profit surged to 34,746.63 Cr in Mar'25 from 20,458.78 Cr in Mar'24. In terms of cash flow, cash flow from operating activities increased to 17,627.00 Cr in Mar'25, while the closing cash and cash equivalents rose to 622.00 Cr from 596.00 Cr in Mar'24. Overall, ITC's financial performance reflects a robust growth trajectory with increasing revenues and profits, despite some fluctuations in specific areas.

View full answer

When is the next results date for ITC?

17-Oct-2025

The next results date for ITC is 30 October 2025.

The next results date for ITC is scheduled for 30 October 2025.

View full answer

Is ITC overvalued or undervalued?

09-Jun-2025

As of January 6, 2025, ITC is considered expensive and overvalued with a PE Ratio of 22.42, lower dividend yield of 1.54% compared to peers, and has underperformed the Sensex, suggesting it may not be a compelling investment at its current price of 423.50.

As of 6 January 2025, the valuation grade for ITC has moved from very expensive to expensive, indicating a slight shift in perception but still suggesting that the stock may be overvalued. The company is currently assessed as overvalued based on its key financial ratios, including a PE Ratio of 22.42, an EV to EBITDA of 19.35, and a PEG Ratio of 1.39. <BR><BR>When compared to peers, ITC's valuation appears less favorable; for instance, Godfrey Phillips has a significantly higher PE Ratio of 37.53, while VST Industries, which is rated as fair, has a PE of 22.98. Additionally, ITC's dividend yield of 1.54% is lower than the industry average, which could further influence investor sentiment. Notably, ITC has underperformed the Sensex on a year-to-date basis with a return of -7.43% compared to the Sensex's 5.61%, reinforcing the view that the stock may not be a compelling investment at its current price of 423.50.

View full answer

Who are the top shareholders of the ITC?

06-Jun-2025

The top shareholders of ITC include Foreign Institutional Investors (39.87%), mutual funds (12.87%), and Tobacco Manufacturers (India) Limited (20.31%), with individual investors holding 12.43%. There are no pledged promoter holdings or a single promoter with the highest stake.

The top shareholders of ITC include Foreign Institutional Investors (FIIs), who hold a significant 39.87% of the shares. Additionally, mutual funds are represented by 51 schemes, accounting for 12.87% of the holdings. The highest public shareholder is Tobacco Manufacturers (India) Limited, which holds 20.31%. Individual investors collectively own 12.43% of the shares. Notably, there are no pledged promoter holdings, and there is no single promoter with the highest holding.

View full answer

What is the bonus history of the ITC?

06-Jun-2025

ITC Ltd. has issued bonuses twice in its history: a 1:2 bonus on July 1, 2016, and a 1:1 bonus on August 3, 2010, rewarding shareholders with additional shares.

ITC Ltd. has a history of bonus issues that includes two notable events. The latest bonus was a 1:2 issue, which was announced with an ex-date of July 1, 2016, and the record date was July 4, 2016. Prior to that, ITC issued a 1:1 bonus on August 3, 2010, with a record date of August 4, 2010. This reflects the company's approach to rewarding its shareholders through bonus shares in the past.

View full answer

Has ITC declared dividend?

06-Jun-2025

Yes, ITC Ltd. has declared a 650% dividend, amounting to ₹6.5 per share, with an ex-date of February 12, 2025. The company has shown strong total returns over various periods, particularly in the long term.

ITC Ltd. has declared a 650% dividend.<BR><BR>Dividend Details:<BR>- Percentage announced: 650%<BR>- Amount per share: 6.5<BR>- Ex-date: 12 Feb 25<BR><BR>Dividend Yield: 1.55%.<BR><BR>Total Returns by Period:<BR>In the last 6 months, the price return was -5.78%, the dividend return was 1.48%, resulting in a total return of -4.3%.<BR><BR>Over the past year, the price return was 1.89%, the dividend return was 1.59%, leading to a total return of 3.48%.<BR><BR>In the 2-year period, the price return was 0.29%, the dividend return was 4.72%, which culminated in a total return of 5.01%.<BR><BR>For the last 3 years, the price return was 61.67%, the dividend return was 11.56%, resulting in a total return of 73.23%.<BR><BR>Over the 4-year period, the price return was 112.65%, the dividend return was 21.02%, leading to a total return of 133.67%.<BR><BR>In the 5-year span, the price return was 122.07%, the dividend return was 31.51%, culminating in a total return of 153.58%.<BR><BR>Overall, ITC Ltd. has declared a substantial dividend, and the total returns over various periods indicate a strong performance, particularly over the longer term, with significant growth in both price and dividends.

View full answer
iScoreScore
Click here to find our call on this stock
Strong Sell
Sell
Hold
Buy
Strong Buy

Dashboard

1

Negative results in Jun 26

  • PAT(Q) At Rs 4,081.88 cr has Fallen at -22.2%
  • NET SALES(Q) At Rs 19,114.37 cr has Fallen at -11.07%
  • CASH AND CASH EQUIVALENTS(HY) Lowest at Rs 3,008.79 cr
2

Consistent Underperformance against the benchmark over the last 3 years

stock-summaryMojo Parameters

Mojo Parameters

Loading Valuation Snapshot...

Stock DNA

stock-summary
Industry

FMCG

stock-summary
Market cap

INR 336,237 Cr (Large Cap)

stock-summary
P/E

17.00

stock-summary
Industry P/E

17

stock-summary
Dividend Yield

5.42%

stock-summary
Debt Equity

-0.29

stock-summary
Return on Equity

28.83%

stock-summary
Price to Book

4.62

Revenue and Profits:
Net Sales:
19,114 Cr
(Quarterly Results - Jun 2026)
Net Profit:
4,394 Cr
stock-summaryTotal Returns
Total Returns (Price + Dividend) stock-summary
Dividend Yield (5.42%)
TimePeriod
Price Return
Dividend Return
Total Return
3 Months
-8.9%
0%
-8.9%
6 Months
-15.18%
2.54%
-12.64%
1 Year
-33.62%
3.52%
-30.1%
2 Years
-43.32%
4.35%
-38.97%
3 Years
-36.15%
8.00%
-28.15%
4 Years
-9.87%
14.52%
4.65%
5 Years
36.85%
25.28%
62.13%

Latest dividend: 8 per share ex-dividend date: May-27-2026

Risk Adjusted Returns v/s stock-summary
Returns Beta
Icon
Beta has not been calculated since enough price history is not available
stock-summaryNews & Corporate Actions

News

P/E at 16.97 vs Industry's 17.37: What the Data Shows for ITC Ltd.

Valuation Picture: Slight Discount Amidst Sector Norms

The current P/E of ITC Ltd. stands at 16.97, marginally below the FMCG industry average of 17.37. This discount suggests that the market is pricing in some caution relative to sector peers. Given the stock’s large-cap status with a market capitalisation of ₹3,36,299.35 crores, this valuation gap is notable but not extreme. The discount may reflect concerns over the company’s recent performance and broader sector challenges, especially in the cigarettes and tobacco segment where 21 out of 109 stocks have reported negative results so far.

Interestingly, the stock offers a high dividend yie...

Read full news article

Announcements stock-summary

Announcement under Regulation 30 (LODR)-Analyst / Investor Meet - Intimation

14-Aug-2026 | Source : BSE

Participation in Investor Conference

Announcement under Regulation 30 (LODR)-Allotment of ESOP / ESPS

14-Aug-2026 | Source : BSE

Allotment of Shares under the Companys Employee Stock Option Schemes

Announcement under Regulation 30 (LODR)-Newspaper Publication

13-Aug-2026 | Source : BSE

Publication of Advertisement re: Loss of Share Certificates

Corporate Actions stock-summary

stock-summary
BOARD MEETING

No Upcoming Board Meetings

stock-summary
DIVIDEND

ITC Ltd. has declared 800% dividend, ex-date: 27 May 26

stock-summary
SPLITS

No Splits history available

stock-summary
BONUS

ITC Ltd. has announced 1:2 bonus issue, ex-date: 01 Jul 16

stock-summary
RIGHTS

No Rights history available

stock-summaryKey Factors

Quality key factors stock-summary

Factor
Value
Sales Growth (5y)
7.72%
EBIT Growth (5y)
7.29%
EBIT to Interest (avg)
100.00
Debt to EBITDA (avg)
Net Debt is too low
Net Debt to Equity (avg)
-0.29
Sales to Capital Employed (avg)
1.00
Tax Ratio
24.59%
Dividend Payout Ratio
87.81%
Pledged Shares
0
Institutional Holding
83.40%
ROCE (avg)
45.54%
ROE (avg)
28.29%

Valuation key factors

Factor
Value
P/E Ratio
17
Industry P/E
17
Price to Book Value
4.60
EV to EBIT
13.02
EV to EBITDA
12.15
EV to Capital Employed
6.10
EV to Sales
4.08
PEG Ratio
NA
Dividend Yield
5.45%
ROCE (Latest)
50.07%
ROE (Latest)
28.83%

Technicals key factors

Indicator
Weekly
Monthly
MACD
Mildly Bullish
Bearish
RSI
No Signal
No Signal
Bollinger Bands
Bearish
Bearish
Moving Averages
Bearish (Daily)
KST
Bearish
Bearish
Dow Theory
Mildly Bearish
Mildly Bearish
OBV
Mildly Bearish
Mildly Bullish
stock-summary Technical Indicator Scale: Bearish, Mildly Bearish, Sideways, Mildly Bullish, Bullish  Turned 
stock-summaryShareholding
Shareholding Snapshot : Jun 2026stock-summary
Shareholding Compare (%holding) stock-summary
Majority shareholders

FIIs

Pledged Promoter Holdings

None

Mutual Funds

Held by 49 Schemes (16.5%)

FIIs

Held by 669 FIIs (34.23%)

Promoter with highest holding

None

Highest Public shareholder

Tobacco Manufacturers (india) Limited (17.79%)

Individual Investors Holdings

13.95%

stock-summaryFinancial
[
  {
    "link": "quarterly",
    "btn_text": "All Quarterly Results",
    "header": "Quarterly Results Snapshot (Consolidated) - Jun'26 - YoY",
    "rhs": [
      {
        "prefix": "Net Sales ",
        "suffix": "YoY Growth in quarter ended Jun 2026 is -11.07% vs 20.91% in Jun 2025",
        "dir": -1
      },
      {
        "prefix": "Consolidated Net Profit ",
        "suffix": "YoY Growth in quarter ended Jun 2026 is -16.21% vs 3.00% in Jun 2025",
        "dir": -1
      }
    ],
    "table": {
      "header": [
        "Jun'26",
        "Jun'25",
        "Change(%)"
      ],
      "body": [
        {
          "field": "Net Sales",
          "val1": "19,114.37",
          "val2": "21,494.79",
          "chgp": "-11.07%",
          "chgp_class": "negative"
        },
        {
          "field": "Operating Profit (PBDIT) excl Other Income",
          "val1": "5,180.86",
          "val2": "6,816.47",
          "chgp": "-23.99%",
          "chgp_class": "negative"
        },
        {
          "field": "Interest",
          "val1": "39.78",
          "val2": "16.47",
          "chgp": "141.53%",
          "chgp_class": "negative"
        },
        {
          "field": "Exceptional Items",
          "val1": "405.88",
          "val2": "0.00",
          "chgp": "",
          "chgp_class": "neutral"
        },
        {
          "field": "Consolidate Net Profit",
          "val1": "4,394.13",
          "val2": "5,244.20",
          "chgp": "-16.21%",
          "chgp_class": "negative"
        },
        {
          "field": "Operating Profit Margin (Excl OI)",
          "val1": "27.27%",
          "val2": "31.89%",
          "chgp": "-4.62%",
          "chgp_class": "negative"
        }
      ]
    }
  },
  {
    "link": "half-yearly",
    "btn_text": "All Half Yearly Results",
    "header": "Half Yearly Results Snapshot (Consolidated) - Sep'25",
    "rhs": [
      {
        "prefix": "Net Sales ",
        "suffix": " Growth in half year ended Sep 2025 is 8.55% vs 8.10% in Sep 2024",
        "dir": 1
      },
      {
        "prefix": "Consolidated Net Profit ",
        "suffix": " Growth in half year ended Sep 2025 is 2.83% vs 0.81% in Sep 2024",
        "dir": 1
      }
    ],
    "table": {
      "header": [
        "Sep'25",
        "Sep'24",
        "Change(%)"
      ],
      "body": [
        {
          "field": "Net Sales",
          "val1": "40,996.42",
          "val2": "37,768.17",
          "chgp": "8.55%",
          "chgp_class": "positive"
        },
        {
          "field": "Operating Profit (PBDIT) excl Other Income",
          "val1": "13,511.16",
          "val2": "13,096.92",
          "chgp": "3.16%",
          "chgp_class": "positive"
        },
        {
          "field": "Interest",
          "val1": "36.52",
          "val2": "24.33",
          "chgp": "50.10%",
          "chgp_class": "negative"
        },
        {
          "field": "Exceptional Items",
          "val1": "88.08",
          "val2": "159.96",
          "chgp": "-44.94%",
          "chgp_class": "negative"
        },
        {
          "field": "Consolidate Net Profit",
          "val1": "10,370.31",
          "val2": "10,084.46",
          "chgp": "2.83%",
          "chgp_class": "positive"
        },
        {
          "field": "Operating Profit Margin (Excl OI)",
          "val1": "33.22%",
          "val2": "34.92%",
          "chgp": "-1.70%",
          "chgp_class": "negative"
        }
      ]
    }
  },
  {
    "link": "nine-monthly",
    "btn_text": "All Nine Monthly Results",
    "header": "Nine Monthly Results Snapshot (Consolidated) - Dec'25",
    "rhs": [
      {
        "prefix": "Net Sales ",
        "suffix": "YoY Growth in nine months ended Dec 2025 is 7.93% vs 8.49% in Dec 2024",
        "dir": -1
      },
      {
        "prefix": "Consolidated Net Profit ",
        "suffix": "YoY Growth in nine months ended Dec 2025 is 1.88% vs -2.08% in Dec 2024",
        "dir": 1
      }
    ],
    "table": {
      "header": [
        "Dec'25",
        "Dec'24",
        "Change(%)"
      ],
      "body": [
        {
          "field": "Net Sales",
          "val1": "61,043.72",
          "val2": "56,558.34",
          "chgp": "7.93%",
          "chgp_class": "positive"
        },
        {
          "field": "Operating Profit (PBDIT) excl Other Income",
          "val1": "20,393.68",
          "val2": "19,458.82",
          "chgp": "4.80%",
          "chgp_class": "positive"
        },
        {
          "field": "Interest",
          "val1": "55.99",
          "val2": "34.15",
          "chgp": "63.95%",
          "chgp_class": "negative"
        },
        {
          "field": "Exceptional Items",
          "val1": "-266.50",
          "val2": "363.40",
          "chgp": "-173.34%",
          "chgp_class": "negative"
        },
        {
          "field": "Consolidate Net Profit",
          "val1": "15,301.50",
          "val2": "15,019.26",
          "chgp": "1.88%",
          "chgp_class": "positive"
        },
        {
          "field": "Operating Profit Margin (Excl OI)",
          "val1": "33.41%",
          "val2": "34.40%",
          "chgp": "-0.99%",
          "chgp_class": "negative"
        }
      ]
    }
  },
  {
    "link": "annual",
    "btn_text": "All Annual Results",
    "header": "Annual Results Snapshot (Consolidated) - Mar'26",
    "rhs": [
      {
        "prefix": "Net Sales ",
        "suffix": "YoY Growth in year ended Mar 2026 is 4.71% vs 10.88% in Mar 2025",
        "dir": -1
      },
      {
        "prefix": "Consolidated Net Profit ",
        "suffix": "YoY Growth in year ended Mar 2026 is -40.46% vs 69.84% in Mar 2025",
        "dir": -1
      }
    ],
    "table": {
      "header": [
        "Mar'26",
        "Mar'25",
        "Change(%)"
      ],
      "body": [
        {
          "field": "Net Sales",
          "val1": "78,868.40",
          "val2": "75,323.34",
          "chgp": "4.71%",
          "chgp_class": "positive"
        },
        {
          "field": "Operating Profit (PBDIT) excl Other Income",
          "val1": "27,317.91",
          "val2": "25,978.21",
          "chgp": "5.16%",
          "chgp_class": "positive"
        },
        {
          "field": "Interest",
          "val1": "85.17",
          "val2": "45.06",
          "chgp": "89.01%",
          "chgp_class": "negative"
        },
        {
          "field": "Exceptional Items",
          "val1": "-291.70",
          "val2": "15,016.01",
          "chgp": "-101.94%",
          "chgp_class": "negative"
        },
        {
          "field": "Consolidate Net Profit",
          "val1": "20,689.47",
          "val2": "34,746.63",
          "chgp": "-40.46%",
          "chgp_class": "negative"
        },
        {
          "field": "Operating Profit Margin (Excl OI)",
          "val1": "34.93%",
          "val2": "34.80%",
          "chgp": "0.13%",
          "chgp_class": "positive"
        }
      ]
    }
  }
]

Quarterly Results Snapshot (Consolidated) - Jun'26 - YoYstock-summary

Jun'26
Jun'25
Change(%)
Net Sales
19,114.37
21,494.79
-11.07%
Operating Profit (PBDIT) excl Other Income
5,180.86
6,816.47
-23.99%
Interest
39.78
16.47
141.53%
Exceptional Items
405.88
0.00
Consolidate Net Profit
4,394.13
5,244.20
-16.21%
Operating Profit Margin (Excl OI)
27.27%
31.89%
-4.62%
Values in Rs Cr.
Direction Arrows
Net Sales

YoY Growth in quarter ended Jun 2026 is -11.07% vs 20.91% in Jun 2025

Direction Arrows
Consolidated Net Profit

YoY Growth in quarter ended Jun 2026 is -16.21% vs 3.00% in Jun 2025

Half Yearly Results Snapshot (Consolidated) - Sep'25stock-summary

Sep'25
Sep'24
Change(%)
Net Sales
40,996.42
37,768.17
8.55%
Operating Profit (PBDIT) excl Other Income
13,511.16
13,096.92
3.16%
Interest
36.52
24.33
50.10%
Exceptional Items
88.08
159.96
-44.94%
Consolidate Net Profit
10,370.31
10,084.46
2.83%
Operating Profit Margin (Excl OI)
33.22%
34.92%
-1.70%
Values in Rs Cr.
Direction Arrows
Net Sales

Growth in half year ended Sep 2025 is 8.55% vs 8.10% in Sep 2024

Direction Arrows
Consolidated Net Profit

Growth in half year ended Sep 2025 is 2.83% vs 0.81% in Sep 2024

Nine Monthly Results Snapshot (Consolidated) - Dec'25stock-summary

Dec'25
Dec'24
Change(%)
Net Sales
61,043.72
56,558.34
7.93%
Operating Profit (PBDIT) excl Other Income
20,393.68
19,458.82
4.80%
Interest
55.99
34.15
63.95%
Exceptional Items
-266.50
363.40
-173.34%
Consolidate Net Profit
15,301.50
15,019.26
1.88%
Operating Profit Margin (Excl OI)
33.41%
34.40%
-0.99%
Values in Rs Cr.
Direction Arrows
Net Sales

YoY Growth in nine months ended Dec 2025 is 7.93% vs 8.49% in Dec 2024

Direction Arrows
Consolidated Net Profit

YoY Growth in nine months ended Dec 2025 is 1.88% vs -2.08% in Dec 2024

Annual Results Snapshot (Consolidated) - Mar'26stock-summary

Mar'26
Mar'25
Change(%)
Net Sales
78,868.40
75,323.34
4.71%
Operating Profit (PBDIT) excl Other Income
27,317.91
25,978.21
5.16%
Interest
85.17
45.06
89.01%
Exceptional Items
-291.70
15,016.01
-101.94%
Consolidate Net Profit
20,689.47
34,746.63
-40.46%
Operating Profit Margin (Excl OI)
34.93%
34.80%
0.13%
Values in Rs Cr.
Direction Arrows
Net Sales

YoY Growth in year ended Mar 2026 is 4.71% vs 10.88% in Mar 2025

Direction Arrows
Consolidated Net Profit

YoY Growth in year ended Mar 2026 is -40.46% vs 69.84% in Mar 2025

stock-summaryCompany CV
About ITC Ltd. stock-summary
stock-summary
ITC Ltd.
Large Cap
FMCG
ITC Limited is one of India's foremost private sector company. ITC has a diversified presence in Cigarettes, Hotels, Paperboards & Specialty Papers, Packaging, AgriBusiness, Packaged Foods & Confectionery, Information Technology, Branded Apparel, Personal Care, Stationery, Safety Matches and other FMCG products.
Company Coordinates stock-summary
Company Details
Virginia House, 37 Jawaharlal Nehru Road Kolkata West Bengal : 700071
stock-summary
Tel: 91-033-22889371
stock-summary
enduringvalue@itc.in
Registrar Details
ITC Ltd., Virginia House, 37 Jawaharlal Nehru Road, Kolkata