
Compare P N Gadgil Jewe. with Similar Stocks
Dashboard
High Management Efficiency with a high ROE of 17.53%
Company has a Debt to Equity ratio (avg) of 0.44 times
Healthy long term growth as Net Sales has grown by an annual rate of 32.80% and Operating profit at 49.19%
Positive results in Mar 26
With ROCE of 16.9, it has a Attractive valuation with a 2.7 Enterprise value to Capital Employed
Majority shareholders : Promoters
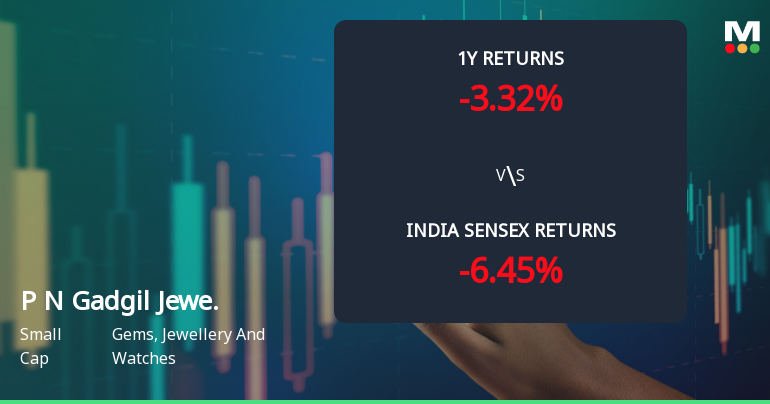
Consistent Underperformance against the benchmark over the last 3 years
Stock DNA
Gems, Jewellery And Watches
INR 7,396 Cr (Small Cap)
18.00
48
0.00%
0.63
21.01%
3.80
Total Returns (Price + Dividend) 
P N Gadgil Jewe. for the last several years.
Risk Adjusted Returns v/s
Returns Beta

News
P N Gadgil Jewellers Ltd Technical Momentum Shifts Amid Sideways Trend
P N Gadgil Jewellers Ltd has experienced a notable shift in its technical momentum, transitioning from a mildly bullish stance to a sideways trend, reflecting a period of consolidation after recent price movements. This change is underscored by mixed signals from key technical indicators including MACD, RSI, Bollinger Bands, and moving averages, suggesting cautious investor sentiment in the Gems, Jewellery and Watches sector.
Read full news article
P N Gadgil Jewellers Ltd is Rated Buy by MarketsMOJO
P N Gadgil Jewellers Ltd is rated 'Buy' by MarketsMOJO, with this rating last updated on 15 June 2026. While the rating change occurred on that date, the analysis and financial metrics discussed here reflect the company’s current position as of 21 June 2026, providing investors with the most up-to-date insight into the stock’s fundamentals, valuation, financial trends, and technical outlook.
Read full news article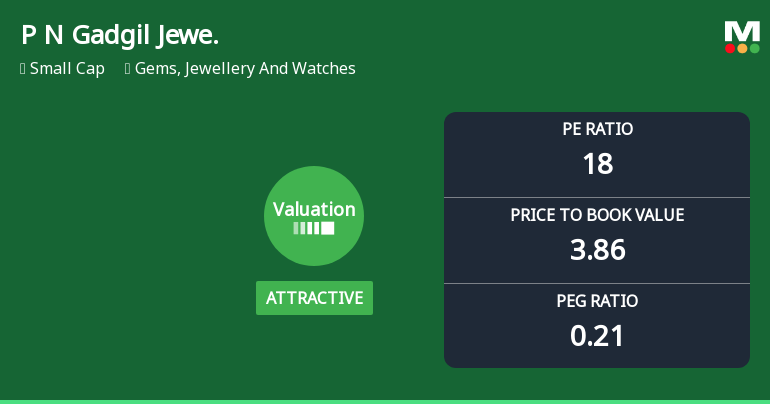
P N Gadgil Jewellers Ltd Valuation Turns Attractive Amid Sector Comparisons
P N Gadgil Jewellers Ltd has witnessed a notable shift in its valuation parameters, moving from a fair to an attractive rating, driven by improved price-to-earnings and price-to-book value metrics relative to its historical averages and peer group. This re-rating comes amid a mixed performance in the gems and jewellery sector, with the company’s fundamentals and market positioning signalling renewed investor interest.
Read full news article Announcements
Announcement under Regulation 30 (LODR)-Earnings Call Transcript
22-May-2026 | Source : BSETranscript of Conference Call held on May 15 2026
Announcement under Regulation 30 (LODR)-Analyst / Investor Meet - Outcome
15-May-2026 | Source : BSEAudio Recording of conference call held on May 15 2026
Management Commentary On Gross Margins For Q4 FY26
15-May-2026 | Source : BSEManagement Commentary on Gross Margins for Q4 FY26
Corporate Actions

No Upcoming Board Meetings

No Dividend history available

No Splits history available

No Bonus history available

No Rights history available
Quality key factors
Valuation key factors
Technicals key factors
 Technical Indicator Scale: Bearish, Mildly Bearish, Sideways, Mildly Bullish, Bullish Turned
 Shareholding Snapshot : Mar 2026
Shareholding Compare (%holding)
Promoters
None
Held by 9 Schemes (4.05%)
Held by 21 FIIs (0.72%)
Svg Business Trust (radhika Saurabh Gadgil) (83.11%)
Bandhan Mutual Fund (1.59%)
10.06%
Quarterly Results Snapshot (Consolidated) - Mar'26 - QoQ

QoQ Growth in quarter ended Mar 2026 is 7.32% vs 51.66% in Dec 2025
QoQ Growth in quarter ended Mar 2026 is -47.19% vs 115.50% in Dec 2025
Half Yearly Results Snapshot (Consolidated) - Sep'25
Growth in half year ended Sep 2025 is 6.07% vs 39.61% in Sep 2024

Growth in half year ended Sep 2025 is 111.63% vs 59.27% in Sep 2024
Nine Monthly Results Snapshot (Consolidated) - Dec'25
YoY Growth in nine months ended Dec 2025 is 17.85% vs 32.71% in Dec 2024
YoY Growth in nine months ended Dec 2025 is 104.48% vs 53.67% in Dec 2024
Annual Results Snapshot (Consolidated) - Mar'26
YoY Growth in year ended Mar 2026 is 39.59% vs 25.87% in Mar 2025
YoY Growth in year ended Mar 2026 is 87.76% vs 40.68% in Mar 2025
About P N Gadgil Jewellers Ltd

Company Coordinates


