
Compare Pine Labs with Similar Stocks
Dashboard
Poor Management Efficiency with a low ROE of 0%
- The company has reported losses. Due to this company has reported negative ROE
The company is Net-Debt Free
Healthy long term growth as Operating profit has grown by an annual rate 0%
With a growth in Net Profit of 18.82%, the company declared Very Positive results in Mar 26
With ROE of 2, it has a Very Expensive valuation with a 3.1 Price to Book Value
Majority shareholders : Non Institution
Stock DNA
Financial Technology (Fintech)
INR 18,579 Cr (Small Cap)
164.00
20
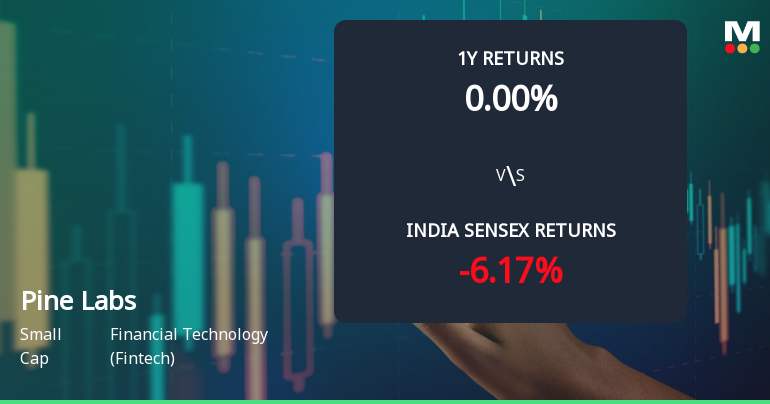
0.00%
-1.32
1.95%
3.14
Total Returns (Price + Dividend) 
Pine Labs for the last several years.
Risk Adjusted Returns v/s
Returns Beta

News
Pine Labs Ltd Technical Momentum Shifts Signal Mild Bullish Outlook
Pine Labs Ltd, a key player in the Financial Technology sector, has exhibited a notable shift in its technical momentum, moving from a sideways trend to a mildly bullish stance. This change is underscored by a 7.5% surge in the stock price on 25 Jun 2026, signalling renewed investor interest amid mixed longer-term returns compared to the broader Sensex index.
Read full news article
Pine Labs Ltd Surges 7.13% to Day's High of Rs 161.85 — Outperforms Sector by 5.25 Percentage Points
The Sensex climbed 1.13% on 24 Jun 2026, yet Pine Labs Ltd outpaced the broader market with a 7.13% gain, touching an intraday high of Rs 161.85. This 5.25 percentage-point outperformance over the IT - Software sector’s 2% advance signals a distinctly stock-specific rally rather than a mere market tailwind.
Read full news article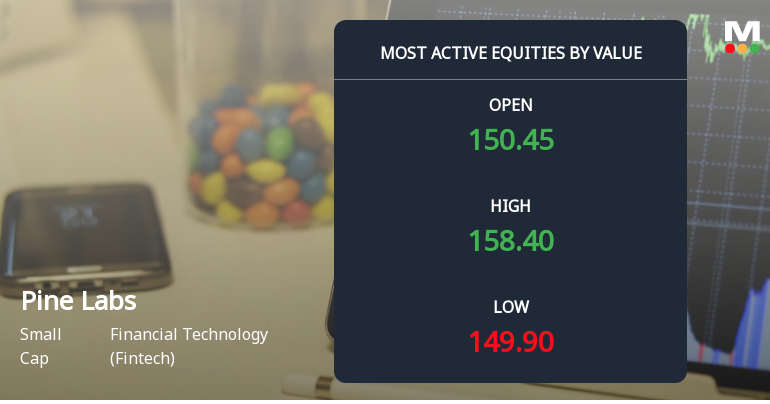
Pine Labs Ltd Sees Robust Trading Activity Amid Institutional Interest
Pine Labs Ltd, a prominent player in the financial technology sector, witnessed significant trading activity on 24 June 2026, driven by strong institutional participation and high value turnover. The stock outperformed its sector peers and the broader market, reflecting renewed investor confidence following an upgrade in its Mojo Grade from Sell to Hold.
Read full news article Announcements
Announcement Under Regulation 30 (LODR)-Updates (Grant Of ESOP)
19-Jun-2026 | Source : BSEAs per enclosed file
Rumour verification - Regulation 30(11)
16-Jun-2026 | Source : BSEAs per the enclosed file
Announcement under Regulation 30 (LODR)-Investor Presentation
16-Jun-2026 | Source : BSEAs per enclosed file
Corporate Actions

No Upcoming Board Meetings

No Dividend history available

No Splits history available

No Bonus history available

No Rights history available
Quality key factors
Valuation key factors
Technicals key factors
 Technical Indicator Scale: Bearish, Mildly Bearish, Sideways, Mildly Bullish, Bullish Turned
 Shareholding Snapshot : Mar 2026
Shareholding Compare (%holding)
Non Institution
None
Held by 22 Schemes (8.88%)
Held by 49 FIIs (4.8%)
None
Peak Xv Partners Pine Investment Holdings (16.81%)
7.41%
Quarterly Results Snapshot (Standalone) - Mar'26 - QoQ

QoQ Growth in quarter ended Mar 2026 is -6.01% vs 26.07% in Dec 2025
QoQ Growth in quarter ended Mar 2026 is 18.82% vs 2,674.09% in Dec 2025
Half Yearly Results Snapshot (Standalone) - Sep'25
Not Applicable: The company has declared_date for only one period
Not Applicable: The company has declared_date for only one period
Nine Monthly Results Snapshot (Standalone) - Dec'25
Not Applicable: The company has declared_date for only one period
Not Applicable: The company has declared_date for only one period
Annual Results Snapshot (Consolidated) - Mar'26
YoY Growth in year ended Mar 2026 is 19.19% vs 28.52% in Mar 2025

YoY Growth in year ended Mar 2026 is 177.33% vs 57.45% in Mar 2025
About Pine Labs Ltd

Company Coordinates


