
Compare Ramkrishna Forg. with Similar Stocks
Stock DNA
Auto Components & Equipments
INR 10,959 Cr (Small Cap)
134.00
46
0.17%
0.69
2.43%
3.27
Total Returns (Price + Dividend) 
Latest dividend: 1 per share ex-dividend date: May-08-2026
Risk Adjusted Returns v/s
Returns Beta

News
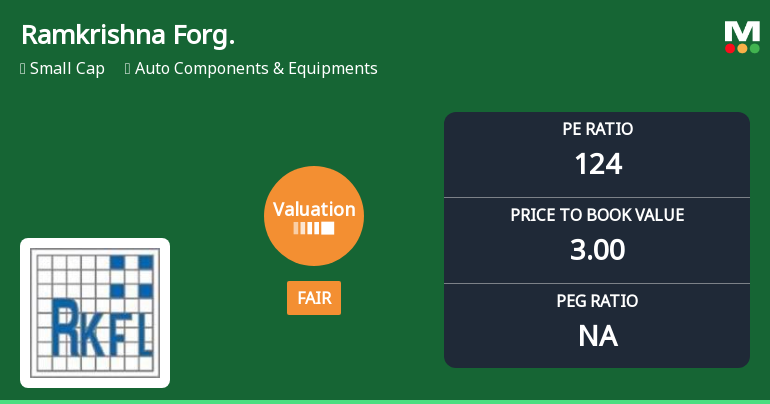
Ramkrishna Forgings Ltd Valuation Shifts to Fair: A Detailed Market Analysis
Ramkrishna Forgings Ltd has witnessed a notable shift in its valuation parameters, moving from an expensive to a fair valuation grade. This change, coupled with its recent performance metrics and peer comparisons, suggests a recalibration of price attractiveness for investors in the auto components sector.
Read full news article
Ramkrishna Forgings Ltd is Rated Hold
Ramkrishna Forgings Ltd is rated 'Hold' by MarketsMOJO, with this rating last updated on 13 May 2026. However, the analysis and financial metrics discussed here reflect the stock's current position as of 08 June 2026, providing investors with an up-to-date view of the company’s fundamentals, returns, and market standing.
Read full news article
Ramkrishna Forgings Ltd is Rated Hold
Ramkrishna Forgings Ltd is rated 'Hold' by MarketsMOJO, with this rating last updated on 13 May 2026. While the rating change occurred on that date, the analysis and financial metrics discussed here reflect the stock's current position as of 08 June 2026, providing investors with an up-to-date view of the company's fundamentals, valuation, financial trends, and technical outlook.
Read full news article Announcements
Disclosures under Reg. 29(2) of SEBI (SAST) Regulations 2011
11-Jun-2026 | Source : BSEThe Exchange has received the disclosure under Regulation 29(2) of SEBI (Substantial Acquisition of Shares & Takeovers) Regulations 2011 for Riddhi Portfolio Pvt Ltd & PACs
Disclosures under Reg. 29(2) of SEBI (SAST) Regulations 2011
11-Jun-2026 | Source : BSEThe Exchange has received the disclosure under Regulation 29(2) of SEBI (Substantial Acquisition of Shares & Takeovers) Regulations 2011 for Riddhi Portfolio Pvt Ltd & PACs
Disclosures under Reg. 29(1) of SEBI (SAST) Regulations 2011
11-Jun-2026 | Source : BSEThe Exchange has received the disclosure under Regulation 29(1) of SEBI (Substantial Acquisition of Shares & Takeovers) Regulations 2011 for Riddhi Portfolio Pvt Ltd & PACs
Corporate Actions

No Upcoming Board Meetings

Ramkrishna Forgings Ltd has declared 50% dividend, ex-date: 08 May 26

Ramkrishna Forgings Ltd has announced 2:10 stock split, ex-date: 14 Mar 22

No Bonus history available

No Rights history available
Quality key factors
Valuation key factors
Technicals key factors
 Technical Indicator Scale: Bearish, Mildly Bearish, Sideways, Mildly Bullish, Bullish Turned
 Shareholding Snapshot : Mar 2026
Shareholding Compare (%holding)
Promoters
15.6271
Held by 18 Schemes (1.33%)
Held by 122 FIIs (21.74%)
Riddhi Portfolio Private Ltd (34.65%)
Smallcap World Fund, Inc (7.97%)
20.03%
Quarterly Results Snapshot (Consolidated) - Mar'26 - QoQ

QoQ Growth in quarter ended Mar 2026 is 10.77% vs 21.05% in Dec 2025

QoQ Growth in quarter ended Mar 2026 is 312.23% vs 242.84% in Dec 2025
Half Yearly Results Snapshot (Consolidated) - Sep'25
Growth in half year ended Sep 2025 is -4.49% vs 16.03% in Sep 2024
Growth in half year ended Sep 2025 is -98.82% vs 20.91% in Sep 2024
Nine Monthly Results Snapshot (Consolidated) - Dec'25
YoY Growth in nine months ended Dec 2025 is -2.12% vs 13.05% in Dec 2024
YoY Growth in nine months ended Dec 2025 is -92.63% vs -13.07% in Dec 2024
Annual Results Snapshot (Consolidated) - Mar'26
YoY Growth in year ended Mar 2026 is 5.06% vs 8.90% in Mar 2025
YoY Growth in year ended Mar 2026 is -82.70% vs 42.52% in Mar 2025
About Ramkrishna Forgings Ltd

Company Coordinates


