

{{notientry.summary}}

5 year annualized RETURNS
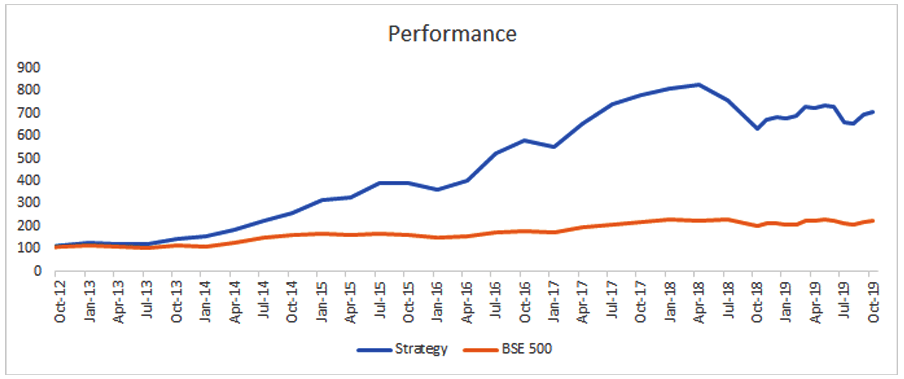
27.9%
11.4%
18.0%
*Annualised returns between Apr 2014 and Oct 2019
^5 year annualised returns.
Back-tested returns between April 2014 and October 2018. Since October the returns are actual.
Past performance is not an indicator of future performance.
Fund Objective
To generate long term capital appreciation from a portfolio invested predominately in good quality companies with good recent financial performance.
The scheme has been designed to generate alpha by investing in good quality companies with excellent financial track record. We use technical indicators to fine tune our entry level to maximise gains in the portfolio. Under this strategy we are willing to buy company even if valuation looks expensive as idea is that good quality companies may command premium, but their financial performance justify the extra premium.
Who should invest?
Investors who aim to generate long term capital appreciation. While there would be periodic churn in the portfolio, this is not a trading product.
What we check in QUALITY?
FREQUENTLY ASKED QUESTIONS
27.9%
11.4%
18.0%
*Annualised returns between Apr 2014 and Oct 2019
^5 year annualised returns.
Back-tested returns between April 2014 and October 2018. Since October the returns are actual.
Past performance is not an indicator of future performance.
24x7 monitoring of stocks
MarketsMojo’s analysis engine runs 24x7 and monitors the developments in the portfolio stocks and other stocks in the market.
We start tracking the stocks across multiple factors relating to Mojo parameters, stock movement etc. as soon as you save the model portfolio.
We will ask you to move out of a stock if its own parameters deteriorate after investment and not because a new top stock has entered.
We will send an email whenever a change needs to be made in the portfolio. For replacement stock a subsequent email for replacement will be sent the next day.
This change will also be reflected on your saved model portfolio transactions page.
The Two USPs of Markets Mojo are - Big Data Analysis and Unbiased Investment Approach.
Big Data Analysis processing more than 500 data points on each company daily
Each listed company is graded on 4 Key Mojo Parameters of
Quality: Long Term Fundamental Strength
Valuation: Attractiveness of stock at current price
Financial Trend: Latest Quarterly Result Performance
Technicals: Price and Volume Trend
After the refining process of Mojo Analysis, the Investment committee takes a call on each stock which is added or removed from the Model Portfolio List.
Unbiased Investment Approach
Being an automated process we avoid the biggest Investment Trap- Human Biases.
We follow a Disciplined & Process-driven approach which does not allow biases to creep in to the investing process Clients should follow the process diligently to achieve the intended returns.
For every user a unique portfolio will be generated within seconds basis his
Model portfolio will be generated based on the top stocks as per Mojo Strategy at the time of investment.
A new model portfolio is generated each day and users who enter at different points in time can have a different portfolio.
Once a user saves a portfolio, he is then tracked basis the stocks that were suggested and any churn based on the parameters of these each stock.
A new portfolio does not mean that stocks in the previous portfolio have deteriorated, it simply means that at any given point of time we would help users invest in the highest rated stocks at that time.
Currently the model portfolio is a 10 stock, equally weighted strategy which is diversified across
At the moment you can only save 1 Model Portfolio. If you need to create a new model portfolio, you will need to delete the existing portfolio and create a fresh one.
No, MarketsMojo will not execute the trades.
At MarketsMojo, we help you create and maintain a model portfolio, you are free to transact with the broker of your choice.
We will send an email whenever a change needs to be made .
This change will also be reflected on your saved model portfolio transactions page.
For return calculations and further tracking we will assume that you have executed the suggested changes.
Based on your executed prices your actual returns may vary from the returns displayed in the model portfolio.
Since you need to execute the trades with your broker, we do not know if you have actually executed these trades.
Hence, we assume that you have taken portfolio actions as suggested and base our future suggestions on this assumption.
No, this is a new portfolio
If you want to make improvements to your existing portfolio, please check the Portfolio Optimizer.
We would suggest an investment horizon of 3 to 5 years in the strategy.
There would be multiple entry and exits throughout the life of the product, we would strongly suggest that you follow the strategy changes in a disciplined manner, else the expected and actual returns may be different.
No, we do not provide target price or holding period on individual stock.
We would suggest changes to the portfolio if there is a change in fundamental or technical variables of the underlying stock.
There would be multiple entry and exits throughout the life of the product, we would strongly suggest that you follow the strategy changes in a disciplined manner, else the expected and actual returns may be different.
Yes, additional investment is allowed up to a max total value of Rs. 1 crore.
Currently, you cannot do partial withdrawal from the portfolio.
There are no guaranteed returns from the strategy.
This product is linked to movements in Equity Markets which can be volatile.