
Compare Waaree Renewab. with Similar Stocks
Dashboard
Company has a Debt to Equity ratio (avg) of 0.05 times
Healthy long term growth as Net Sales has grown by an annual rate of 203.35% and Operating profit at 160.33%
With a growth in Net Sales of 131.31%, the company declared Outstanding results in Mar 26
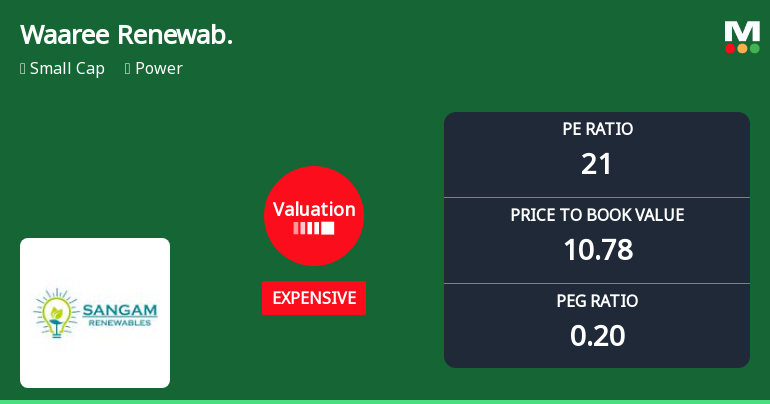
With ROE of 51.2, it has a Expensive valuation with a 11 Price to Book Value
Despite the size of the company, domestic mutual funds hold only 0.29% of the company
Total Returns (Price + Dividend) 
Latest dividend: 1 per share ex-dividend date: Jan-24-2025
Risk Adjusted Returns v/s
Returns Beta

News
Waaree Renewable Technologies Ltd: Valuation Shift Signals Price Attractiveness Change
Waaree Renewable Technologies Ltd has witnessed a notable shift in its valuation parameters, moving from a fair to an expensive rating, reflecting evolving investor sentiment amid strong operational metrics and a competitive power sector landscape. This article analyses the recent changes in key valuation multiples, compares them with peer averages and historical benchmarks, and assesses the implications for investors.
Read full news article
Waaree Renewable Technologies Ltd is Rated Hold
Waaree Renewable Technologies Ltd is rated 'Hold' by MarketsMOJO, with this rating last updated on 06 April 2026. However, the analysis and financial metrics discussed here reflect the company’s current position as of 12 June 2026, providing investors with the latest insights into its performance and outlook.
Read full news article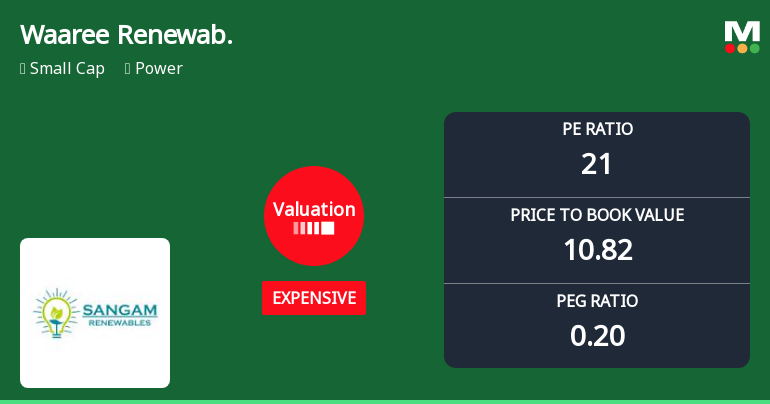
Waaree Renewable Technologies Ltd Valuation Shifts Signal Changing Market Sentiment
Waaree Renewable Technologies Ltd has witnessed a notable shift in its valuation parameters, moving from a fair to an expensive rating, reflecting evolving investor sentiment amid robust operational metrics and a competitive power sector landscape.
Read full news article Announcements
Disclosure Under Regulation 30 Of The SEBI (Listing Obligation And Disclosure Requirements) Regulations 2015-Completion Of Acquisition
18-Jun-2026 | Source : BSEPlease find attached herewith intimation of completion of acquisition of Associated Power Structures Private Limited
Announcement under Regulation 30 (LODR)-Award_of_Order_Receipt_of_Order
17-Jun-2026 | Source : BSEWith reference to our earlier intimation dated February 20 2024 and November 10 2025 we are please to inform you that the Company has received enhancement to existing scope.
Disclosure Under Regulation 30 Of The SEBI (Listing Obligation And Disclosure Requirements) Regulations 2015 - Update On Acquisition Of Associated Power Structures Private Limited (Formerly Known As Associated Power Structures Limited)
15-Jun-2026 | Source : BSEIn continuation of our intimation dated 26th January 2026 and 07th May 2026 regarding acquisition of Associated Power Structures Private Limited please find attached updated on the same.
Corporate Actions

No Upcoming Board Meetings

Waaree Renewable Technologies Ltd has declared 50% dividend, ex-date: 24 Jan 25

Waaree Renewable Technologies Ltd has announced 2:10 stock split, ex-date: 15 Mar 24

Waaree Renewable Technologies Ltd has announced 57:100 bonus issue, ex-date: 21 Jul 14

No Rights history available
Quality key factors
Valuation key factors
Technicals key factors
 Technical Indicator Scale: Bearish, Mildly Bearish, Sideways, Mildly Bullish, Bullish Turned
 Shareholding Snapshot : Mar 2026
Shareholding Compare (%holding)
Promoters
None
Held by 7 Schemes (0.07%)
Held by 75 FIIs (1.85%)
Waaree Energies Limited (74.32%)
Hitesh P Mehta (1.05%)
19.53%
Quarterly Results Snapshot (Consolidated) - Mar'26 - YoY

YoY Growth in quarter ended Mar 2026 is 131.31% vs 74.37% in Mar 2025

YoY Growth in quarter ended Mar 2026 is 66.02% vs 82.72% in Mar 2025
Half Yearly Results Snapshot (Consolidated) - Sep'25
Growth in half year ended Sep 2025 is 81.12% vs 172.70% in Sep 2024
Growth in half year ended Sep 2025 is 147.73% vs 177.89% in Sep 2024
Nine Monthly Results Snapshot (Consolidated) - Dec'25
YoY Growth in nine months ended Dec 2025 is 98.81% vs 85.87% in Dec 2024
YoY Growth in nine months ended Dec 2025 is 138.61% vs 44.45% in Dec 2024
Annual Results Snapshot (Consolidated) - Mar'26
YoY Growth in year ended Mar 2026 is 108.51% vs 82.30% in Mar 2025
YoY Growth in year ended Mar 2026 is 108.89% vs 54.70% in Mar 2025
About Waaree Renewable Technologies Ltd

Company Coordinates


